Difference between revisions of "SRAS for materials characterisation"
| Line 3: | Line 3: | ||
[[Image:SRAS_System.PNG | thumb|300px ]] | [[Image:SRAS_System.PNG | thumb|300px ]] | ||
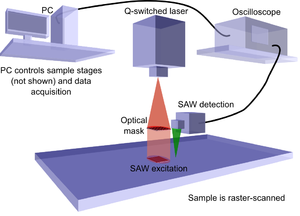
SRAS stands for Spatially Resolved Acoustic Spectroscopy, it is a technique for mapping the surface acoustic wave velocity of a material. The technique is analogous to optical spectroscopy techniques where analysis of the optical spectrum and the wavelengths that are most readily transmitted or absorbed tells us some properties of the sample being examined. In the acoustic sense we monitor the spectrum of sound waves emitted from a grating source. The technique can be performed two ways, the first is to use a fixed frequency source and sweep the grating spacing or the grating period can be fixed and the frequency is swept. | SRAS stands for Spatially Resolved Acoustic Spectroscopy, it is a technique for mapping the surface acoustic wave velocity of a material. The technique is analogous to optical spectroscopy techniques where analysis of the optical spectrum and the wavelengths that are most readily transmitted or absorbed tells us some properties of the sample being examined. In the acoustic sense we monitor the spectrum of sound waves emitted from a grating source. The technique can be performed two ways, the first is to use a fixed frequency source and sweep the grating spacing or the grating period can be fixed and the frequency is swept. | ||
| − | [[Image:SRAS_300dpi_emda_sras.png | | + | |
| − | [[Image:SRAS_300dpi_sras_austenitic_ss.png| | + | |
| + | {|class="wikitable" align="right" | ||
| + | |- | ||
| + | |[[Image:SRAS_300dpi_emda_sras.png| 150px ]][[Image:SRAS_300dpi_sras_austenitic_ss.png | 150px]] | ||
| + | |} | ||
| + | |||
| + | |||
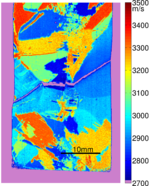
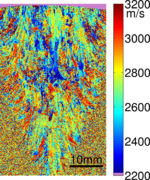
To measure the acoustic spectrum at each point on the sample a fixed grating is illuminated with a short laser pulse (typically ~1ns). As the laser pulse contains a broad range of frequencies, only the frequencies which match the grating spacing and acoustic velocity of that sample point will be generated. We measure the waves that have been generated close to the excitation region (see top figure). We can then calculate the frequencies generated and with the knowledge of the grating spacing we can obtain the acoustic velocity using v = fλ. If the sample is raster scanned we build up a detailed image of the sample velocity for that propagation direction. These images show the grain structure of the material and are very useful for material scientists for assessing the properties of the material. | To measure the acoustic spectrum at each point on the sample a fixed grating is illuminated with a short laser pulse (typically ~1ns). As the laser pulse contains a broad range of frequencies, only the frequencies which match the grating spacing and acoustic velocity of that sample point will be generated. We measure the waves that have been generated close to the excitation region (see top figure). We can then calculate the frequencies generated and with the knowledge of the grating spacing we can obtain the acoustic velocity using v = fλ. If the sample is raster scanned we build up a detailed image of the sample velocity for that propagation direction. These images show the grain structure of the material and are very useful for material scientists for assessing the properties of the material. | ||
| Line 10: | Line 16: | ||
==EMDA Sponsored Instrument== | ==EMDA Sponsored Instrument== | ||
| + | |||
| + | |||
| + | ==From Velocity to Orientation== | ||
| Line 18: | Line 27: | ||
<br style="clear:both" /> | <br style="clear:both" /> | ||
| − | |||
| − | |||
==History of the technique== | ==History of the technique== | ||
Revision as of 09:39, 5 April 2011
Whats is SRAS
SRAS stands for Spatially Resolved Acoustic Spectroscopy, it is a technique for mapping the surface acoustic wave velocity of a material. The technique is analogous to optical spectroscopy techniques where analysis of the optical spectrum and the wavelengths that are most readily transmitted or absorbed tells us some properties of the sample being examined. In the acoustic sense we monitor the spectrum of sound waves emitted from a grating source. The technique can be performed two ways, the first is to use a fixed frequency source and sweep the grating spacing or the grating period can be fixed and the frequency is swept.
|
To measure the acoustic spectrum at each point on the sample a fixed grating is illuminated with a short laser pulse (typically ~1ns). As the laser pulse contains a broad range of frequencies, only the frequencies which match the grating spacing and acoustic velocity of that sample point will be generated. We measure the waves that have been generated close to the excitation region (see top figure). We can then calculate the frequencies generated and with the knowledge of the grating spacing we can obtain the acoustic velocity using v = fλ. If the sample is raster scanned we build up a detailed image of the sample velocity for that propagation direction. These images show the grain structure of the material and are very useful for material scientists for assessing the properties of the material.
EMDA Sponsored Instrument
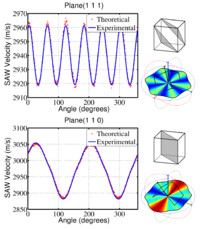
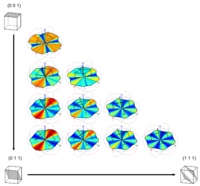
From Velocity to Orientation
