Difference between revisions of "NDE for AM"
Rikesh Patel (talk | contribs) (Created page with "_NOTOC_ =NDE for AM= Our optics group is currently working on a number of ways to perform non-destructive evaluation on additive manufactured parts. This is an important field ...") |
Don Milesh (talk | contribs) |
||
| (51 intermediate revisions by 3 users not shown) | |||
| Line 1: | Line 1: | ||
| − | + | __NOTOC__ | |
| − | = | + | ==Motivation== |
| + | Additive manufacturing offers a paradigm shift in engineering as previous design constraints, such as tooling paths in matching are removed. The ability to create novel free form structures, such as lattices, clearly offers vast potential benefits for high performance industries including aerospace, medical and tooling. However, the uptake of AM components has been hindered as the process are prone to a variety of defects, such as porosity and cracking, which due to the variation in length scales, 10 µm to 500 µm, and the number of processing parameters, >150, make predicting and optimising against these defects near-impossible. | ||
| − | + | As such, our optics group is currently working on a number of ways to perform non-destructive evaluation on additive manufactured (AM) parts; currently, XCT is widely used in industry for part validation but is a strictly post-process ex-situ technique and has both time and safety implications. Our aim is to take advantage of the layer-by-layer nature of the AM process to inspect during the build to create a volumetric dataset and validate the part in real-time. Further to real-time validation of the component in-situ inspection offers opportunities to adjust build parameters during the build based on processing signal, analogous with the closed-loop feedback used in conventional machining. Alongside the management of components defects in AM significant research in the field is also dedicated to understanding the microstructure and subsequent mechanical properties of the AM components; in future it is envisaged that the processes can be adapted as such to tailor the component microstructure for a given role, as such a technique which can both verify a components integrity and interrogate the microstructure will be well placed to meet the demands, both current and future, of the AM industry, | |
| − | ==SRAS on | + | ==SRAS on Additive Manufacturing== |
| + | Our existing laser ultrasound technique [[SRAS_for_materials_characterisation|SRAS]] has previously been used to image the microstructure of metallic samples, giving both grain size and orientation, making it an interesting tool for investigation of SLM samples. Furthermore, In addition to this useful information, the loss of signal or a drastic change in signal amplitude/frequency can be used to measure the presence of both defects on the surface and in the near-surface region. These capabilities combined with the fact SRAS is a non-contact, non-destructive technique makes it an ideal candidate for AM components. | ||
| − | The | + | The first SRAS data from AM samples were obtained using the [[OSAM|O-SAM]] system in 2011. The two figures below illustrate the SAW velocity across a blown powder and wire deposited samples with the SAW propagating in the direction of the white arrows. These initial data sets paved the way for the following generations of SRAS system to further investigate the capabilities of SRAS as an NDE tool for AM. |
| + | |||
| + | {|align="center" | ||
| + | |[[Image:2011_OSAM_Blown_powder.jpg|600px|thumb|link=|SRAS SAW velocity images of blown powder deposited MERL76 sample.]] | ||
| + | |[[Image:2011_OSAM_Wire_deposited.jpg|600px|thumb|link=|SRAS SAW velocity images of wire deposited waspaloy sample.]] | ||
| + | |} | ||
| + | |||
| + | |||
| + | In 2016 a more modern SRAS system was used on Selective Laser Melting (SLM) samples. This system demonstrated a relationship between the mean SAW velocity and laser power used to build eleven cubes using Ti-6Al-4V powder. As the laser was power increased, an increase in the mean SAW velocity was measured. It was also shown how an in-process SRAS inspection could provide closed-loop feedback to improve the SLM process as a whole. When specifically considering pores, it was shown that alongside detecting, counting and sizing the surface pores, the system was also able to detect subsurface pores. This was in the form of a drastic change in the SAW velocity by ~300 ms<sup>-1</sup>, wherein the thin plate-like region above the pores, the SAW transformed into a Lamb wave. | ||
| + | |||
| + | {|align="center" | ||
| + | |[[Image:2016_EMDA_SLMvsPower.jpg|600px|thumb|link=|(top) A selection of optical maps and (bottom) velocity maps from the central region on the samples. Pores are present on all samples, the velocity variation is similar for the first 3 samples presented, and the 140 W sample shows a drop in mean velocity. Scale bar 0.5 mm.]] | ||
| + | |[[Image:2019_EMDA_SLM_pore_count.jpg|600px|thumb|link=|Defect data used to calculate the normalised circularity and aspect ratio (left) and the number of defects found as ranked by their area (right).]] | ||
| + | |} | ||
| + | |||
| + | {|align="center" | ||
| + | |[[Image:2016_EMDA_SLMvsPower_grapph.jpg|600px|thumb|link=|Average acoustic amplitude and velocity data presented for each SLM specimen. The velocity decreases with build power and is not dependant on the acoustic amplitude as the 190 W and 200 W samples had similar acoustic amplitude to the lower power samples, yet their velocity was as expected for well-consolidated material.]] | ||
| + | |[[Image:2016_EMDA_SLM_subsurface.jpg|600px|thumb|link=|Images for the 190 W AM test sample (a) Optical image (scale bar 1 mm) (b) Optical zoom (scale bar 250 µm), (c) SEM micrograph of the corresponding area (scale bar 250 µm) and inset zoom of large pore (scale bar 25 µm). (d) Acoustic velocity map (scale bar 1 mm) (e) zoom of acoustic data (scale bar 250 µm) (f) XCT subsurface (with no surface) data of zoomed region up to an approximate depth of 60 ?m (scale bar 250 µm)]] | ||
| + | |} | ||
| + | |||
| + | The next set of experiments carried out in 2017 were aimed at understanding the capability of SRAS to detect changes to build process, specifically the scan strategies used. Four 10 mm cubes were manufactured using a nickel superalloy power (CM247LC) on a Realizer SLM machine. The cubes were made up of four small 5 mm square islands. One sample was used as a control (0°) and the islands were rotated on the other three samples relative to the previous layer. The rotation angles were set to 15°, 30° and 45° across the tree samples. Using SRAS data and verified by optical microscopy several trends were identified between the crack and pore distribution relative to the island rotation angle. Furthermore, the island boundaries were identified using SRAS based on their distinctly different drop in the group SAW velocity. | ||
| + | |||
| + | {|align="center" | ||
| + | |[[Image:2016_EMDA_SLM_Islands_Schematic.jpg|600px|thumb|link=|Schematic plan view of: (a) 00°; and (b) 45° hatch angle samples with equally sized square islands, illustrating how the scan lines are consistently aligned to the set angle across each layer.]] | ||
| + | |||
| + | |[[Image:2016_EMDA_SLM_Islands.jpg|600px|thumb|link=|Optical images of SRAS scans of varying hatch angle samples showing some variations in porosity (top row) and velocity maps of varying hatch angle samples showing clear indications of island boundaries as regions of low velocity (bottom row) (0.5 mm scale bar).]] | ||
| + | |||
| + | |[[Image:2016_EMDA_SLM_Islands_OverScan.jpg|600px|thumb|link=|Plan view of the overall scan strategy for a 30° sample. The region in which the scan lines overshoot the assigned island is highlighted with green arrows alongside both SRAS optical and velocity maps of the same region. Outlined in black, the optical image shows no indication of the scan lines, whereas the velocity map clearly illustrates a change in this region.]] | ||
| + | |} | ||
| + | |||
| + | Some further work was carried out towards understanding the data obtained using SRAS from form AM samples. In this case, both the cross-section and sidewall of Wire–arc additive manufacturing (WAAM) samples were inspected using SRAS. Here we are able to identify the differences between undeformed and rolled samples. These Ti-6Al-4V specimens form prior-β grains, that then transition to an extreamly fine alpha α-microstructure. Whilst the grain size of this final microstucture is below the spatial reslution of the SRAS instrument, variations in velocity between the prior structures and varaitons in the angular dispersion were measured. These are effects are caused by the limited number, 12, of orietations that can result from a single prior-β grain, resulting in a hetrogenous microstucture between prior grains that is easily measured by SRAS. Using a rough surface detector, as discussed below, would allow such measurements to be made during the build process for important quality control. | ||
| + | |||
| + | {|align="center" | ||
| + | |[[Image:2019_WAAM_sidewall.jpg|600px|thumb|link=|Results from prepared side-wall (x–z). Scale bars indicate 2 mm. (a) SRAS velocity map from undeformed specimen, annotated lines have been added to indicate vertical prior-β grain growth. (b) SRAS velocity map from 75 kN rolled specimen, large prior-β features can no longer be discerned.]] | ||
| + | |[[Image:2019_WAAM_cross_section.jpg|600px|thumb|link=|Results from y–z plane cross-section specimens, (a)–(d) undeformed specimen (e)–(f) 75 kN rolled specimen. (a) Etched macrograph, (i) showing prior-β formation, (ii) interface at layers of deposition, (iii) fusion boundary and (iv) final deposited layer which has not been reheated. (b) and (c) Micrographs taken after etching scale bar indicates 250 μm, (c) shows the interface between two prior-β grains. (d) SRAS velocity map corresponding to (a). (e) 45° SRAS velocity map from 75 kN rolled specimen and (f) 90° SRAS velocity map from 75 kN rolled specimen. All Scale bars indicates 2 mm, except in (b) and (c).]] | ||
| + | |} | ||
| + | |||
| + | This was applied to a triangular SLM sample. Here changes to the microstructure were detected using SRAS and confirmed using EBSD. This was due to the relatively shorter scan lines at the tip resulting in a longer overall dwell time for the heat source in that region. From our forward model solver we can suggest slower velocities are closer to [111] orientations and faster velcoities nearer [001] orientations, applying this rule of thumb and comparing to the EBSD orientation dataset shows good corrolation. It is also intresting to note the boundary interfaces are present in the velcoity map, that suggests there is potential a large crystallographic misorientation between these areas. | ||
| + | |||
| + | {|align="center" | ||
| + | |[[Image:2019_Triangle_VenNOpt.jpg|600px|thumb|link=|SRAS datasets produced from scanning of the Inconel 718 triangle sample.Scale bar shown in (b) indicated 2 mm.]] | ||
| + | |[[Image:2019_Triangle_TipNEBSD.jpg|600px|thumb|link=|Crystalline texture comparison in Inconel 718 triangle, by SRAS and EBSD.]] | ||
| + | |[[Image:2019_Triangle_VelGradient.jpg|600px|thumb|link=|SAW velocity gradient in the specimen, large velocity gradients are suggestive of orientation or directional stiffness mismatches. Scale bar indicates 2 mm.]] | ||
| + | |} | ||
| + | |||
| + | As an initial step towards closed-loop feedback for AM, SRAS optical data was used to inform several repair strategies on a sample manufactured using SLM. Although the resolution of the SRAS system used was quoted as 100 µm for the acoustic images, its optical resolution was much higher than this at ~10 µm per pixel. Following some image processing, the centroid and aspect ratio dimensions for each defect was used to target the rework strategies used. An area of 150% of the identified defect size was used to ensure sufficient material was remelted to reduce the final defect size. The feasibility of this methodology developed was demonstrated by achieving a 50% reduction in defect depth and a change in the defect morphology. This allowed the next layer of powder to more easily backfill the existing surface pores which could help improve the overall part density and reduce porosity. | ||
| + | |||
| + | {|align="center" | ||
| + | |[[Image:2018_repair_optical.jpg|600px|thumb|link=|Micrograph analysis steps outlining the order of operations for preparation of pores for rework: (a) the original optical data set; (b) removing outliers (defects < 20 µm ); (c) morphological closing based on eroding and dilating the binary image; (d) segmentation based on their aspect ratio and centroid for determination of dimensions and location; (e) the rework paths are created and overlaid; (f) magnified image of rework area showing individual hatch lines. The defect highlighted has been denoted d1 and its respective rework path has been denoted r1.]] | ||
| + | |[[Image:2018_repair_micrographs.jpg|600px|thumb|link=|Optical micrographs of spherical pores of Inconel 718 samples (a)–(d) and their respective reworks (e)–(h); (e) and (f) are hatching rework strategies, (g) is a spiral rework strategy and (h) is a single shot rework. 3D views and line profiles of an exemplary pore are shown for pre rework d2 and post rework r2; (i) 3D view of existing surface pore; (j) line profile through the lowest point below the surface of the pore; (k) 3D view of the reworked area; (l) line profile through the lowest point below the surface of the rework. The line profile location is marked in red and blue for the pre rework and post rework, respectively.]] | ||
| + | |} | ||
| + | |||
| + | In 2018 one of the biggest challenges to carrying out an in-process SRAS inspection was addressed. The surface roughness inherent to AM process, such as SLM, are a particular challnges for laser ultrasound technques due to the diffuse reflection of the probe beam. Laser ultrasonics although common in industry are primarily used on flat or prepared surfaces (as was the case for all of the SRAS AM data above). A variety of interferometric technqiues are insensitive to this phenomena such - as as the Fabry-Perot interferometer —or can be made to adapt — such as two-wave mixing or random quadrature demodulation, however in-house solution known as the speckle knife edge detector (SKED) has been devloped. Switching from a knife-edge detector (KED) to a SKED increased the capability of SRAS from only work on samples in the region of 0.1 µm Ra up to ~2 µm Ra. | ||
| + | |||
| + | {|align="center" | ||
| + | |[[Image:KED_vs_SKED.jpg|600px|thumb|link=|An illustrative laser ultrasound detection outline on a (a) smooth, (b) rough surface. On a smooth surface (a), the small deflection of a singular return beam can be measured using a knife edge detector, however, on a rough surface (b), the change in intensity seen on either photodiode due to the deflection of the speckle field is not detectable. The speckle knife edge detector (SKED) ‘splits’ the incident speckles into left/right channels across its detector array, allowing it to detect the small deflections in the speckle field.]] | ||
| + | [[Image:2018_SKED_capsule.jpg|600px|thumb|link=|Photographs (a) and (b) show the current implementation of the SKED device inside a 35 mm cage plate holder. The length of the device is roughly 30 mm. The render (c) of the SKED chip shows the array of 32 × 32 active circuit photodetectors.]] | ||
| + | |[[Image:2018_SKED_vs_EMDA.jpg|600px|thumb|link=|A large grain Ti6246 block (a) was scanned using both the smooth surface SRAS setup and rough surface SRAS setup. The values shown in (a) indicates the roughness (in Ra) in that area of the sample. The measured SAW velocity (m/s) of the sample is shown in (b) using the smooth surface setup (c) using the rough surface setup. A box in (b) indicates the area of the sample that were scanned using both systems. Images (d,e) show the maximum signal amplitude (arb. units) detected using the smooth and rough surface setups respectively—both images show a decrease in response in the rougher region (which supports the findings from the previous experiment), however, a measurable signal is still observable when using the rough surface setup in the rough region.]] | ||
| + | |} | ||
| + | |||
| + | This overall progression in SRAS was translated to AM using a benchtop system as photographed below. The rough surface data illustrated here was a milestone in the SRAS AM journey. The AM sample inspected was manufactured using a Renishaw AM250 and Ti64 powder. Its surface was measured using an Alicona infinite focus microscope to have a Sa of 6.11 µm (a fair representation of current build quality). A SRAS inspection was carried out on the as-deposited surface of this sample at an acoustic wavelength of 250 µm. | ||
| + | |||
| + | |||
| + | {|align="center" | ||
| + | |[[Image:2018_SKED_Benchtop_system.jpg|600px|thumb|link=|A photograph of the rough-surface SRAS setup showing key component and the laser beam paths. The reflected speckles are captured through a large 50.8 mm lens, with the pattern imaged onto the SKED chip array. Precise control of the detection beam focus is required to ensure the speckles appear larger than two photodetectors on the SKED—this is confirmed by using observing configuration pattern of the SKED device via a USB output.]] | ||
| + | |[[Image:2018_SKED_paper_AM_Rouhness.jpg|600px|thumb|link=|(a) Photograph of the Ti64 selective laser melting (SLM) sample under inspection, (b) a surface profile map of the SLM sample measured using the focus variation microscope, (c) height parameters measured using the microscope, which includes the highlighted Sa value (∼6 µm).]] | ||
| + | [[Image:SKED_SLM.png|600px|thumb|link=|(left) Optical micrograph of the Ti64 SLM sample (right) SRAS velocity map of a 3 mm × 5 mm area on the Ti64 SLM sample. The sample was scanned using a step size of 25 µm in both directions, therefore the image produced is oversampled. In areas where a low or no signal is measured, it is coloured grey. Similar features can be seen in both images, which includes surface cavities and the line mark.]] | ||
| + | |} | ||
| + | |||
| + | The next step in the process of integrating SRAS into an AM build platform was a proof of concept system. Here the rough surface SRAS system discussed above was installed on top of a Renishaw AM250 build chamber. The SRAS laser train was delivered into the build chamber via an f-theta lens and translated across the surface using a glavo mirrors - both optical components that are commonly used in SLM build platforms. This prototype system demonstrated the capability of SRAS instrument to work alongside an SLM build laser train. | ||
| + | |||
| + | The short video linked below demonstrates how this worked within a typical workshop as a class 1 laser safe system. | ||
| + | |||
| + | https://youtu.be/CMZValFnWdk | ||
| + | |||
| + | {|align="center" | ||
| + | |[[Image:2018_NDE_for_AM_Build_chamber.JPG|600px|thumb|link=|Photograph of prototype SRAS system built on top of a Renishaw AM250 build chamber carrying out measurements on an as-built SLM sample.]] | ||
| + | |[[Image:2018_NDE_for_AM_Plan_View.png|600px|thumb|link=|Top down photograph of the prototype SRAS system illustrating the beam paths of the generation IR and detection green lasers.]] | ||
| + | |} | ||
| + | |||
| + | Some ongoing work in this area involves the construction and optimisation of a compact lab-based rough surface SRAS system, which still incorporates the galvo mirrors and f-theta lens brought across from the SLM build chamber prototype system. Rough surfaces systems have and continue to capture velocity maps from AM surfaces of a variety of process and quality. Such a system is now an good candicate for full integration withing a function AM system. We have developed a framework to assess the temporal impact of SRAS, compared to other inspection systems, for SLM manufacture. This framework can be tailored to minimic real-life build specimens and parameters, providing information on the SRAS scan stategy to minimse impact on build time whilst maximising infromation civerage in key areas. This goes hand-in-hand with work on dynamic resolution and critical area detection. In future, by incorporating the SRAS instrument into the SLM build machine, it shall be possible to image [http://optics.eee.nottingham.ac.uk/w/images/5/59/SrasAM.gif 3D renders] both defects and the microstructure on a layer-by-layer basis allowing tailoring of the microsturture, on the fly adjustment of build parmaters and correction of defective parts. | ||
| + | |||
| + | At the time of writing two dovetailed challenges remain. 1. Extracting ever greater information on the microstucture and other mechanical properties of specimens with grain size below the spatial reosltuon of the instrument. 2. Greatly increasing the spatial resolution of SRAS (orders of magnitude - beyond simple optical adjustments), to enable full orientation to be recovered in specimens with small grain sizes. In relation to the first point, investigations into high-silicon steel have allowed SAW velcoity maps to be correlated to magnetic anisotropy of SLM components, and the build pattern. To improve the spatial reolution, picosecond pump-probe tecnqiues are under testing for nano-scale microstucture imaging. | ||
| + | |||
| + | {|align="center" | ||
| + | |[[Image:2020_NDE4AM_Ongoing.jpg|600px|thumb|link=| (a) Photograph of the new rough surface SRAS setup mounted on an optical plate,(b) an image taken using a picosecond laser ultrasound setup to map microstructure at the sub-micron level, (c) an isometric SRAS image of high silicon steel showing the direction of columnar grains off three prepared surfaces.]] | ||
| + | |} | ||
| + | |||
| + | |||
| + | |||
| + | |||
| + | <!-- | ||
| + | |||
| + | |||
| + | [[Image:Figure_6_lambmodes.png|450px|thumb|link=|SRAS scan of an SLM manufactured Ti-6Al-4V sample, it is clear that surface-breaking defects can clearly be seen, and it is suggested that the clear areas of 'green' velocity correspond to subsurface defects]] | ||
| + | |||
| + | [[Image:buildchamber.png|450px|thumb|link=|SLM build platform adapted for SRAS optical train, with beam deliver through galvanometer scanning mirrors and f-theta lens.]] | ||
| + | |||
| + | [[Image:NDEforAM_paper3_CM247.pdf|500px|thumb|link=|SLM manufactured CM247-LC sample, it is clear that the SRAS technique can detect changes in the microstructure from the island scan strategy ]] | ||
| + | |||
| + | There is both a variety of different techniques and terminology, used in the field of additive manufacturing and one of the most interesting of these is Selective Laser Melting (SLM), also known as powder bed fusion or direct metal laser sintering. Using a high power laser, small powder particles, normally of performance alloys such as Ti-6Al-4V or Inconel 718, are melted together to create relatively small components with intricate geometrical features. | ||
| + | |||
| + | --> | ||
| + | |||
| + | ==Research Team== | ||
| + | |||
| + | [https://www.nottingham.ac.uk/engineering/people/adam.clare Adam Clare], [[Matt Clark]], [[Richard Smith]], [[Wenqi Li]], [[Rikesh Patel]], [[Rafael Fuentes|Rafael Fuentes Dominguez]], [[Don Milesh Pieris|Don Pieris]] and [[Paul Dryburgh]] are actively working on this project. Previous contributors include [[Steve Sharples]], [https://www.researchgate.net/profile/Matthias_Hirsch2 Matthias Hirsch] and [[Samuel Achamfuo-Yeboah|Samuel Osei Achamfuo-Yeboah]]. | ||
| + | |||
| + | ==Related Publications and Talks== | ||
| + | Publications | ||
| + | <bibtex> | ||
| + | @article{smith2016spatially, | ||
| + | title={Spatially resolved acoustic spectroscopy for selective laser melting}, | ||
| + | author={R. J. Smith and M. Hirsch and P. Patel and W. Li and A. T. Clare and S. D. Sharples}, | ||
| + | journal={Journal of Materials Processing Technology}, | ||
| + | volume={236}, | ||
| + | pages={93--102}, | ||
| + | year={2016}, | ||
| + | publisher={Elsevier}, | ||
| + | url={https://www.sciencedirect.com/science/article/pii/S0924013616301352} | ||
| + | } | ||
| + | </bibtex> | ||
| + | |||
| + | <bibtex> | ||
| + | @article{hirsch2017assessing, | ||
| + | title={Assessing the capability of in-situ nondestructive analysis during layer based additive manufacture}, | ||
| + | author={M. Hirsch and R. Patel and W. Li and G. Guan and R. K. Leach and S. D. Sharples and A. T. Clare}, | ||
| + | journal={Additive Manufacturing}, | ||
| + | volume={13}, | ||
| + | pages={135--142}, | ||
| + | year={2017}, | ||
| + | publisher={Elsevier}, | ||
| + | url={https://www.sciencedirect.com/science/article/pii/S2214860416301877} | ||
| + | } | ||
| + | </bibtex> | ||
| + | |||
| + | <bibtex> | ||
| + | @article{hirsch2017meso, | ||
| + | title={Meso-scale defect evaluation of selective laser melting using spatially resolved acoustic spectroscopy}, | ||
| + | author={M. Hirsch and S. Catchpole-Smith and R. Patel and P. Marrow and W. Li and C. Tuck and S. D. Sharples and A. T. Clare}, | ||
| + | journal={Proc. R. Soc. A}, | ||
| + | volume={473}, | ||
| + | number={2205}, | ||
| + | pages={170--194}, | ||
| + | year={2017}, | ||
| + | organization={The Royal Society}, | ||
| + | url={http://rspa.royalsocietypublishing.org/content/473/2205/20170194} | ||
| + | } | ||
| + | </bibtex> | ||
| + | |||
| + | <bibtex> | ||
| + | @article{hirsch2018, | ||
| + | title={Targeted rework strategies for powder bed additive manufacture}, | ||
| + | author={M. Hirsch and P. Dryburgh and R. Patel and S. Catchpole-Smith and L. Perry and S. D. Sharples and I. A. Ashcroft and A. T. Clare}, | ||
| + | journal={Additive Manufacturing}, | ||
| + | volume={19}, | ||
| + | pages={127-133}, | ||
| + | year={2018}, | ||
| + | publisher={Elsevier}, | ||
| + | url ={https://www.sciencedirect.com/science/article/pii/S2214860417303925} | ||
| + | } | ||
| + | </bibtex> | ||
| + | |||
| + | <bibtex> | ||
| + | @article{Patel2018, | ||
| + | title = "Imaging Material Texture of As-Deposited Selective Laser Melted Parts Using Spatially Resolved Acoustic Spectroscopy ", | ||
| + | journal = "Applied Sciences", | ||
| + | volume = "8", | ||
| + | number = "10", | ||
| + | pages = "1991", | ||
| + | year = "2018", | ||
| + | note = "", | ||
| + | doi = "https://doi.org/10.3390/app8101991", | ||
| + | url = "https://www.mdpi.com/2076-3417/8/10/1991", | ||
| + | author = "R. Patel and M. Hirsch and P. Dryburgh and D. Pieris and S. Achamfuo-Yeboah and R. Smith and R. Light and S.D. Sharples, A.T. Clare and Matt Clark", | ||
| + | } | ||
| + | </bibtex> | ||
| + | |||
| + | <bibtex> | ||
| + | @article{Pieris2019, | ||
| + | title = "Spatially resolved acoustic spectroscopy towards online inspection of additive manufacturing", | ||
| + | journal = "Insight - Non-Destructive Testing & Condition Monitoring", | ||
| + | volume = "61", | ||
| + | number = "3", | ||
| + | pages = "132-137", | ||
| + | year = "2019", | ||
| + | note = "", | ||
| + | doi = "https://doi.org/10.1784/insi.2019.61.3.132", | ||
| + | author = "D. Pieris and R. Patel and P. Dryburgh and M. Hirsch and W. Li and S. Sharples and R.J. Smith and A.T. Clare and M. Clark", | ||
| + | } | ||
| + | </bibtex> | ||
| + | |||
| + | <bibtex> | ||
| + | @article{Dryburgh2019, | ||
| + | title = "Spatially Resolved Acoustic Spectroscopy for Integrity Assessment in Wire-Arc Additive Manufacturing", | ||
| + | journal = "Additive Manufacturing", | ||
| + | volume = "28", | ||
| + | number = "C", | ||
| + | pages = "236-251", | ||
| + | year = "2019", | ||
| + | note = "", | ||
| + | doi = "https://doi.org/10.1016/j.addma.2019.04.015 ", | ||
| + | author = "P. Dryburgh and D. Pieris and F.Martina and R. Patel and S. Sharples and W. Li and A.T. Clare and S. Williams and R.J. Smith", | ||
| + | } | ||
| + | </bibtex> | ||
| + | |||
| + | <bibtex> | ||
| + | @article{Dryburgh2019_2, | ||
| + | title = "Spatially resolved acoustic spectroscopy for texture imaging in powder bed fusion nickel superalloys", | ||
| + | journal = "AIP Conference Proceedings", | ||
| + | volume = "2102", | ||
| + | number = "1", | ||
| + | pages = "020004", | ||
| + | year = "2019", | ||
| + | note = "", | ||
| + | doi = "https://doi.org/10.1063/1.5099708", | ||
| + | author = "P. Dryburgh, R. Patel, D. M. Pieris, M. Hirsch, W. Li, S. D. Sharples, R. J. Smith, A. T. Clare, M. Clark", | ||
| + | } | ||
| + | </bibtex> | ||
| + | |||
| + | <bibtex> | ||
| + | @article{Pieris2020, | ||
| + | title = "Laser Induced Phased Arrays (LIPA) to detect nested features in additively manufactured components", | ||
| + | journal = "Materials & Design", | ||
| + | volume = "187", | ||
| + | number = "108412", | ||
| + | pages = "", | ||
| + | year = "2020", | ||
| + | note = "", | ||
| + | doi = "https://doi.org/10.1016/j.matdes.2019.108412", | ||
| + | author = "D. Pieris and T. Stratoudaki and Y. Javadi and P. Lukacs and S. Catchpole-Smith and P. D. Wilcox and A. Clare and M. Clark", | ||
| + | } | ||
| + | </bibtex> | ||
| + | |||
| + | <bibtex> | ||
| + | @article{Bai2020, | ||
| + | title = "The effect of distortion models on characterisation of real defects using ultrasonic arrays", | ||
| + | journal = "NDT & E International", | ||
| + | volume = "113", | ||
| + | number = "102263", | ||
| + | pages = "", | ||
| + | year = "2020", | ||
| + | note = "", | ||
| + | doi = "https://doi.org/10.1016/j.ndteint.2020.102263", | ||
| + | author = "L. Bai and A. Velichko and A. T. Clare and P. Dryburgh and D. Pieris and B. W. Drinkwater", | ||
| + | } | ||
| + | </bibtex> | ||
| + | |||
| + | Conference Papers | ||
| + | |||
| + | <bibtex> | ||
| + | @inproceedings{sharples_lu13, | ||
| + | title="The SKED: Speckle Knife Edge Detector", | ||
| + | author="S. D. Sharples and R. A. Light and S. O. Achamfuo-Yeboah and M. Clark and M. G. Somekh", | ||
| + | year="2013", | ||
| + | booktitle="3rd International Symposium on Laser-Ultrasonics and Advanced Sensing, Yokohama, Japan", | ||
| + | doi = "https://doi.org/110.1088/1742-6596/520/1/012004", | ||
| + | url = "http://iopscience.iop.org/article/10.1088/1742-6596/520/1/012004", | ||
| + | series = "Journal of Physics: Conference Series", | ||
| + | volume ="581" | ||
| + | } | ||
| + | </bibtex> | ||
| + | |||
| + | <bibtex> | ||
| + | @inproceedings{SAY14, | ||
| + | title="Optical detection of ultrasound from optically rough surfaces using a custom CMOS sensor", | ||
| + | author="S. O. Achamfuo-Yeboah and R. A. Light and S. D Sharples", | ||
| + | year="2014", | ||
| + | series = "Journal of Physics: Conference Series", | ||
| + | volume ="581" | ||
| + | booktitle="13th Anglo-French Physical Acoustics Conference (AFPAC2014)", | ||
| + | doi = "https://doi.org/10.1088/1742-6596/581/1/012009", | ||
| + | url = "http://iopscience.iop.org/article/10.1088/1742-6596/581/1/012009/meta" | ||
| + | } | ||
| + | </bibtex> | ||
| + | |||
| + | <bibtex> | ||
| + | @inproceedings{PDLU2018, | ||
| + | title="Targeted rework of powder bed fusion additive manufacturing", | ||
| + | author="P. Dryburgh and R. Patel and S. Catchpole-Smith and M. Hirsch and L. Perry and R. J. Smith and M. Clark and I. A. Ashcroft and A. T. Clare", | ||
| + | year="2018", | ||
| + | booktitle="Proceedings of LPM2018 - the 19th International Symposium on Laser Precision Microfabrication", | ||
| + | url = "https://nottingham-repository.worktribe.com/output/1190715/targeted-rework-of-powder-bed-fusion-additive-manufacturing" | ||
| + | } | ||
| + | </bibtex> | ||
| + | |||
| + | <bibtex> | ||
| + | @inproceedings{DP2018, | ||
| + | title="Spatially resolved acoustic spectroscopy additive manufacturing: towards online inspection", | ||
| + | author="D. M.Pieris and R. Patel and P. Dryburgh and M. Hirsch and W. Li and S. D. Sharples and R. J. Smith and A. T. Clare and M. Clark", | ||
| + | year="2018", | ||
| + | booktitle="Proceedings of BINDT2018 - the 57th Annual British Conference on Non-Destructive Testing", | ||
| + | url = "https://nottingham-repository.worktribe.com/output/1191130/spatially-resolved-acoustic-spectroscopy-additive-manufacturing-towards-online-inspection" | ||
| + | } | ||
| + | </bibtex> | ||
| + | |||
| + | Conferences presented <div class=" mw-collapsible mw-collapsed" style="width:1100px; overflow:auto;"> | ||
| + | |||
| + | |||
| + | <bibtex> | ||
| + | @inproceedings{patel_afpac15, | ||
| + | title={On using laser ultrasonic non-destructive evaluation for additive manufactured samples}, | ||
| + | author={Patel Rikesh and Guan Guanying and Hirsch Matthias and Li Wenqi and Smith Richard J. and Achamfuo-Yeboah Samual and Light Roger A. and Clare Adam T. and Tuck Chris and Clark Matt and Sharples Steve D.}, | ||
| + | year={2015}, | ||
| + | booktitle={15th Anglo-French Physical Acoustics Conference, Fréjus, France} | ||
| + | } | ||
| + | </bibtex> | ||
| + | |||
| + | <bibtex> | ||
| + | @inproceedings{clare_bindt, | ||
| + | title={In-Process monitoring of Additive Layer Manufacturing}, | ||
| + | author={Clare Adam T. and Sharples Steve D. and Tuck Chris and Groom Kristian and Hirsch Matthias and Patel Rikesh and Li Wenqi and Smith Richard J. and Guan Guanying}, | ||
| + | year={2015}, | ||
| + | booktitle={ 54th Annual Conference of The British Institute of Non-Destructive Testing, Telford, UK} | ||
| + | } | ||
| + | </bibtex> | ||
| + | |||
| + | <bibtex> | ||
| + | @inproceedings{patel_lu15, | ||
| + | title={On using laser ultrasonic non-destructive evaluation for additive manufactured samples}, | ||
| + | author={Patel Rikesh and Hirsch Matthias and Li Wenqi and Smith Richard J. and Achamfuo-Yeboah Samual and Tuck Chris and Clark Matt and Clare Adam T. and Sharples Steve D.}, | ||
| + | year={2015}, | ||
| + | booktitle={4th International Symposium on Laser-Ultrasonics and Advanced Sensing, Illinois, USA} | ||
| + | } | ||
| + | </bibtex> | ||
| + | |||
| + | <bibtex> | ||
| + | @inproceedings{patel_QNDE15, | ||
| + | title={On using laser ultrasonic non-destructive evaluation for additive manufactured samples}, | ||
| + | author={Patel Rikesh and Hirsch Matthias and Li Wenqi and Smith Richard J. and Achamfuo-Yeboah Samual and Tuck Chris and Clark Matt and Clare Adam T. and Sharples Steve D.}, | ||
| + | year={2015}, | ||
| + | booktitle={42nd Annual Review of Progress in Quantitative Nondestructive Evaluation Conference, Minneapolis, USA} | ||
| + | } | ||
| + | </bibtex> | ||
| + | |||
| + | <bibtex> | ||
| + | @inproceedings{patel_lu16, | ||
| + | title={Laser ultrasonic inspection of as-deposited AM samples}, | ||
| + | author={Patel Rikesh and Hirsch Matthias and Smith Richard J. and Achamfuo-Yeboah Samual and Clare Adam T. and Sharples Steve D.}, | ||
| + | year={2016}, | ||
| + | booktitle={5th International Symposium on Laser-Ultrasonics and Advanced Sensing, Linz, Austria} | ||
| + | } | ||
| + | </bibtex> | ||
| + | |||
| + | <bibtex> | ||
| + | @inproceedings{clare_cirp, | ||
| + | title={In-Process monitoring of Additive Layer Manufacturing}, | ||
| + | author={Clare Adam T. and Sharples Steve D. and Leach Richard K. and Guan Guanying and Hirsch Matthias and Patel Rikesh}, | ||
| + | year={2016}, | ||
| + | booktitle={66th CIRP General Assembly, Guimarães, Portugal} | ||
| + | } | ||
| + | </bibtex> | ||
| + | |||
| + | <bibtex> | ||
| + | @inproceedings{clare_euspen, | ||
| + | title={Approaches for AM in-process inspection using SRAS and OCT}, | ||
| + | author={Clare Adam T. and Hirsch Matthias and Guan Guanying and Patel Rikesh and Li Wenqi and Dryburgh Paul and Milesh Pieris Don and Sharples Steve D.}, | ||
| + | year={2017}, | ||
| + | booktitle={EUSPEN Special Interest Group Meeting: Quality Control for Additive Manufacturing, Coventry, UK} | ||
| + | } | ||
| + | </bibtex> | ||
| + | |||
| + | <bibtex> | ||
| + | @inproceedings{PierisOU, | ||
| + | title={Detection and Manipulation of AM Component Microstructure using SRAS}, | ||
| + | author={Pieris Don M. and Catchpole-Smith Sam and Patel Rikesh and Hirsch Matthias and Dryburgh Paul and Li Wenqi and Sharples Steve D. and Smith Richard and Clare Adam T. and Clark Matt}, | ||
| + | year={2017}, | ||
| + | booktitle={Institute of Physics: Optics and Ultrasound IV, University of Strathclyde, UK} | ||
| + | } | ||
| + | </bibtex> | ||
| + | |||
| + | <bibtex> | ||
| + | @inproceedings{ClareMAPP, | ||
| + | title={Finding and Fixing Defects in Metal Powder Bed Systems}, | ||
| + | author={Clare Adam T. and Dryburgh Paul and Pieris Don M. and Patel Rikesh and and Li Wenqi and Smith Richard and Clark Matt}, | ||
| + | year={2018} | ||
| + | booktitle={Manufacture using Advanced Powder Processes: 1st International Conference} | ||
| + | } | ||
| + | </bibtex> | ||
| + | |||
| + | <bibtex> | ||
| + | @inproceedings{Pieris2019, | ||
| + | title={LIPA for AM}, | ||
| + | author={Pieris Don M.}, | ||
| + | year={2019} | ||
| + | booktitle={QNDE: 47th Annual Review of Progress in Quantitative Nondestructive Evaluation} | ||
| + | } | ||
| + | </bibtex> | ||
| + | |||
| + | <bibtex> | ||
| + | @inproceedings{Patel2019, | ||
| + | title={SRAS for AM}, | ||
| + | author={Patel Rikesh}, | ||
| + | year={2019} | ||
| + | booktitle={International Congress on Ultrasound 2019} | ||
| + | } | ||
| + | </bibtex> | ||
| + | |||
| + | <bibtex> | ||
| + | @inproceedings{Pieris2019_2, | ||
| + | title={LIPA for AM}, | ||
| + | author={Pieris Don M.}, | ||
| + | year={2019} | ||
| + | booktitle={International Congress on Ultrasound 2019} | ||
| + | } | ||
| + | </bibtex> | ||
| + | |||
| + | <bibtex> | ||
| + | @inproceedings{Dryburgh2019, | ||
| + | title={Materials characterisation in AM with SRAS}, | ||
| + | author={Dryburgh Paul}, | ||
| + | year={2019} | ||
| + | booktitle={15th Nondestructive Characterisation of Materials Conference} | ||
| + | } | ||
| + | </bibtex> | ||
| + | |||
| + | |||
| + | </div> | ||
Latest revision as of 10:17, 30 October 2020
Motivation
Additive manufacturing offers a paradigm shift in engineering as previous design constraints, such as tooling paths in matching are removed. The ability to create novel free form structures, such as lattices, clearly offers vast potential benefits for high performance industries including aerospace, medical and tooling. However, the uptake of AM components has been hindered as the process are prone to a variety of defects, such as porosity and cracking, which due to the variation in length scales, 10 µm to 500 µm, and the number of processing parameters, >150, make predicting and optimising against these defects near-impossible.
As such, our optics group is currently working on a number of ways to perform non-destructive evaluation on additive manufactured (AM) parts; currently, XCT is widely used in industry for part validation but is a strictly post-process ex-situ technique and has both time and safety implications. Our aim is to take advantage of the layer-by-layer nature of the AM process to inspect during the build to create a volumetric dataset and validate the part in real-time. Further to real-time validation of the component in-situ inspection offers opportunities to adjust build parameters during the build based on processing signal, analogous with the closed-loop feedback used in conventional machining. Alongside the management of components defects in AM significant research in the field is also dedicated to understanding the microstructure and subsequent mechanical properties of the AM components; in future it is envisaged that the processes can be adapted as such to tailor the component microstructure for a given role, as such a technique which can both verify a components integrity and interrogate the microstructure will be well placed to meet the demands, both current and future, of the AM industry,
SRAS on Additive Manufacturing
Our existing laser ultrasound technique SRAS has previously been used to image the microstructure of metallic samples, giving both grain size and orientation, making it an interesting tool for investigation of SLM samples. Furthermore, In addition to this useful information, the loss of signal or a drastic change in signal amplitude/frequency can be used to measure the presence of both defects on the surface and in the near-surface region. These capabilities combined with the fact SRAS is a non-contact, non-destructive technique makes it an ideal candidate for AM components.
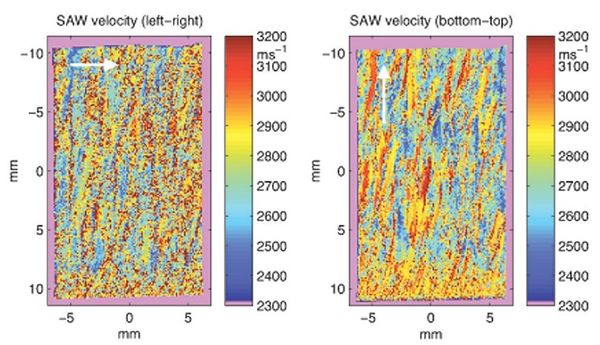
The first SRAS data from AM samples were obtained using the O-SAM system in 2011. The two figures below illustrate the SAW velocity across a blown powder and wire deposited samples with the SAW propagating in the direction of the white arrows. These initial data sets paved the way for the following generations of SRAS system to further investigate the capabilities of SRAS as an NDE tool for AM.
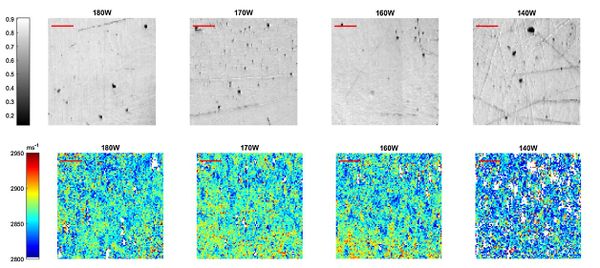
In 2016 a more modern SRAS system was used on Selective Laser Melting (SLM) samples. This system demonstrated a relationship between the mean SAW velocity and laser power used to build eleven cubes using Ti-6Al-4V powder. As the laser was power increased, an increase in the mean SAW velocity was measured. It was also shown how an in-process SRAS inspection could provide closed-loop feedback to improve the SLM process as a whole. When specifically considering pores, it was shown that alongside detecting, counting and sizing the surface pores, the system was also able to detect subsurface pores. This was in the form of a drastic change in the SAW velocity by ~300 ms-1, wherein the thin plate-like region above the pores, the SAW transformed into a Lamb wave.
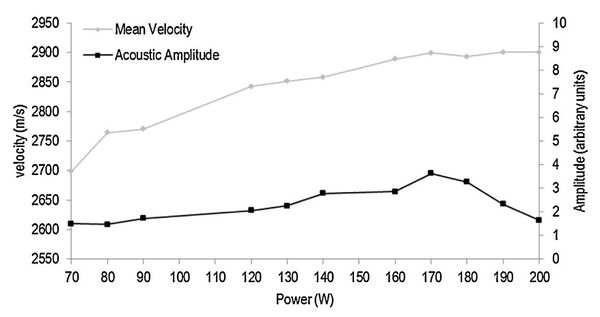 Average acoustic amplitude and velocity data presented for each SLM specimen. The velocity decreases with build power and is not dependant on the acoustic amplitude as the 190 W and 200 W samples had similar acoustic amplitude to the lower power samples, yet their velocity was as expected for well-consolidated material. |
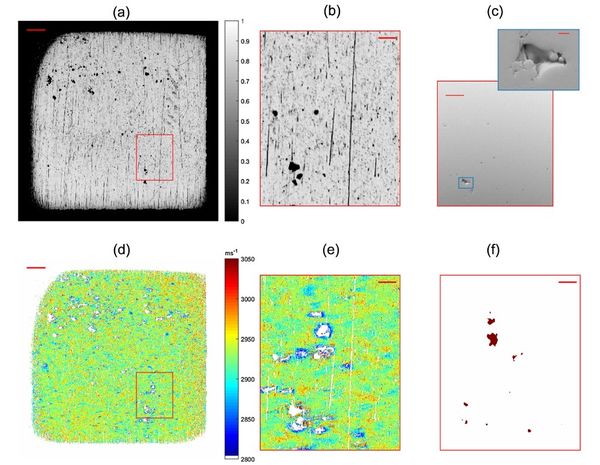 Images for the 190 W AM test sample (a) Optical image (scale bar 1 mm) (b) Optical zoom (scale bar 250 µm), (c) SEM micrograph of the corresponding area (scale bar 250 µm) and inset zoom of large pore (scale bar 25 µm). (d) Acoustic velocity map (scale bar 1 mm) (e) zoom of acoustic data (scale bar 250 µm) (f) XCT subsurface (with no surface) data of zoomed region up to an approximate depth of 60 ?m (scale bar 250 µm) |
The next set of experiments carried out in 2017 were aimed at understanding the capability of SRAS to detect changes to build process, specifically the scan strategies used. Four 10 mm cubes were manufactured using a nickel superalloy power (CM247LC) on a Realizer SLM machine. The cubes were made up of four small 5 mm square islands. One sample was used as a control (0°) and the islands were rotated on the other three samples relative to the previous layer. The rotation angles were set to 15°, 30° and 45° across the tree samples. Using SRAS data and verified by optical microscopy several trends were identified between the crack and pore distribution relative to the island rotation angle. Furthermore, the island boundaries were identified using SRAS based on their distinctly different drop in the group SAW velocity.
 Plan view of the overall scan strategy for a 30° sample. The region in which the scan lines overshoot the assigned island is highlighted with green arrows alongside both SRAS optical and velocity maps of the same region. Outlined in black, the optical image shows no indication of the scan lines, whereas the velocity map clearly illustrates a change in this region. |
Some further work was carried out towards understanding the data obtained using SRAS from form AM samples. In this case, both the cross-section and sidewall of Wire–arc additive manufacturing (WAAM) samples were inspected using SRAS. Here we are able to identify the differences between undeformed and rolled samples. These Ti-6Al-4V specimens form prior-β grains, that then transition to an extreamly fine alpha α-microstructure. Whilst the grain size of this final microstucture is below the spatial reslution of the SRAS instrument, variations in velocity between the prior structures and varaitons in the angular dispersion were measured. These are effects are caused by the limited number, 12, of orietations that can result from a single prior-β grain, resulting in a hetrogenous microstucture between prior grains that is easily measured by SRAS. Using a rough surface detector, as discussed below, would allow such measurements to be made during the build process for important quality control.
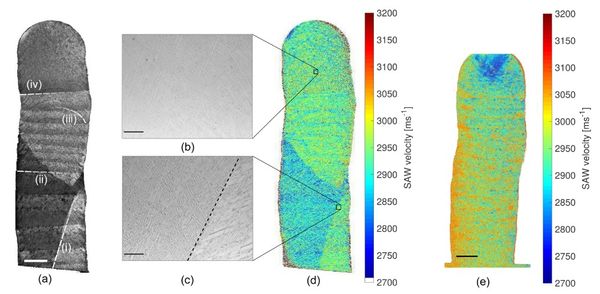 Results from y–z plane cross-section specimens, (a)–(d) undeformed specimen (e)–(f) 75 kN rolled specimen. (a) Etched macrograph, (i) showing prior-β formation, (ii) interface at layers of deposition, (iii) fusion boundary and (iv) final deposited layer which has not been reheated. (b) and (c) Micrographs taken after etching scale bar indicates 250 μm, (c) shows the interface between two prior-β grains. (d) SRAS velocity map corresponding to (a). (e) 45° SRAS velocity map from 75 kN rolled specimen and (f) 90° SRAS velocity map from 75 kN rolled specimen. All Scale bars indicates 2 mm, except in (b) and (c). |
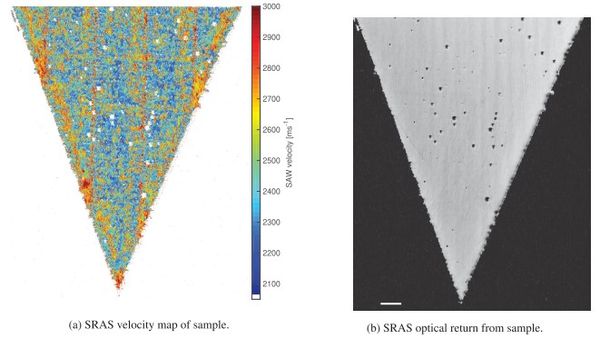
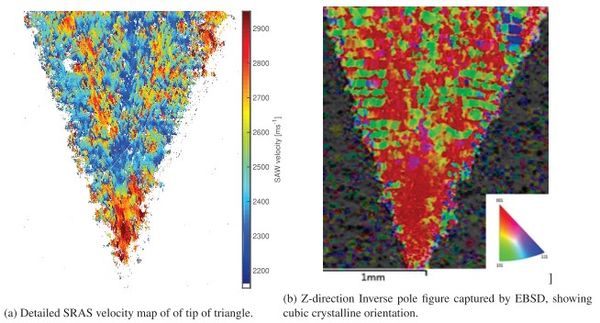
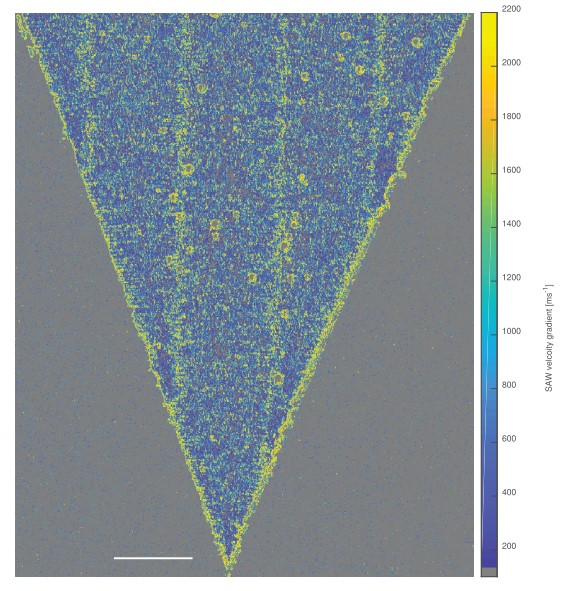
This was applied to a triangular SLM sample. Here changes to the microstructure were detected using SRAS and confirmed using EBSD. This was due to the relatively shorter scan lines at the tip resulting in a longer overall dwell time for the heat source in that region. From our forward model solver we can suggest slower velocities are closer to [111] orientations and faster velcoities nearer [001] orientations, applying this rule of thumb and comparing to the EBSD orientation dataset shows good corrolation. It is also intresting to note the boundary interfaces are present in the velcoity map, that suggests there is potential a large crystallographic misorientation between these areas.
As an initial step towards closed-loop feedback for AM, SRAS optical data was used to inform several repair strategies on a sample manufactured using SLM. Although the resolution of the SRAS system used was quoted as 100 µm for the acoustic images, its optical resolution was much higher than this at ~10 µm per pixel. Following some image processing, the centroid and aspect ratio dimensions for each defect was used to target the rework strategies used. An area of 150% of the identified defect size was used to ensure sufficient material was remelted to reduce the final defect size. The feasibility of this methodology developed was demonstrated by achieving a 50% reduction in defect depth and a change in the defect morphology. This allowed the next layer of powder to more easily backfill the existing surface pores which could help improve the overall part density and reduce porosity.
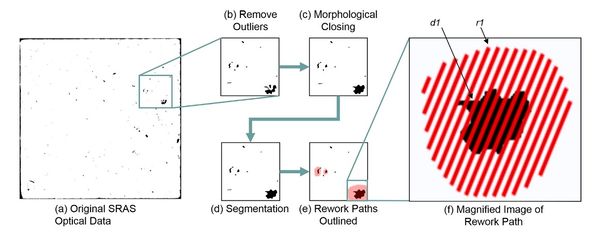 Micrograph analysis steps outlining the order of operations for preparation of pores for rework: (a) the original optical data set; (b) removing outliers (defects < 20 µm ); (c) morphological closing based on eroding and dilating the binary image; (d) segmentation based on their aspect ratio and centroid for determination of dimensions and location; (e) the rework paths are created and overlaid; (f) magnified image of rework area showing individual hatch lines. The defect highlighted has been denoted d1 and its respective rework path has been denoted r1. |
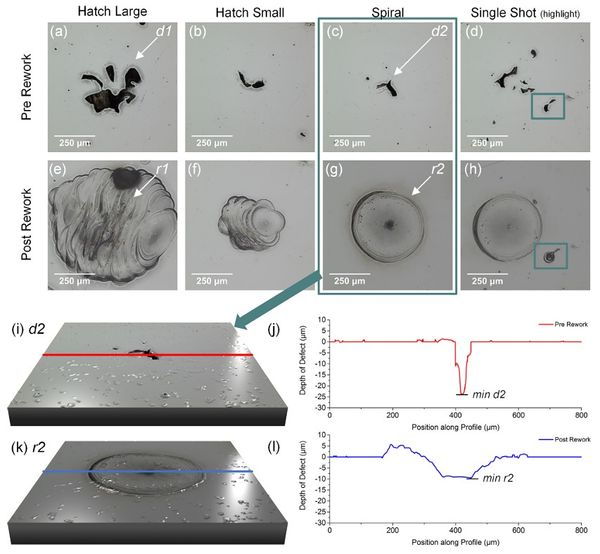 Optical micrographs of spherical pores of Inconel 718 samples (a)–(d) and their respective reworks (e)–(h); (e) and (f) are hatching rework strategies, (g) is a spiral rework strategy and (h) is a single shot rework. 3D views and line profiles of an exemplary pore are shown for pre rework d2 and post rework r2; (i) 3D view of existing surface pore; (j) line profile through the lowest point below the surface of the pore; (k) 3D view of the reworked area; (l) line profile through the lowest point below the surface of the rework. The line profile location is marked in red and blue for the pre rework and post rework, respectively. |
In 2018 one of the biggest challenges to carrying out an in-process SRAS inspection was addressed. The surface roughness inherent to AM process, such as SLM, are a particular challnges for laser ultrasound technques due to the diffuse reflection of the probe beam. Laser ultrasonics although common in industry are primarily used on flat or prepared surfaces (as was the case for all of the SRAS AM data above). A variety of interferometric technqiues are insensitive to this phenomena such - as as the Fabry-Perot interferometer —or can be made to adapt — such as two-wave mixing or random quadrature demodulation, however in-house solution known as the speckle knife edge detector (SKED) has been devloped. Switching from a knife-edge detector (KED) to a SKED increased the capability of SRAS from only work on samples in the region of 0.1 µm Ra up to ~2 µm Ra.
 An illustrative laser ultrasound detection outline on a (a) smooth, (b) rough surface. On a smooth surface (a), the small deflection of a singular return beam can be measured using a knife edge detector, however, on a rough surface (b), the change in intensity seen on either photodiode due to the deflection of the speckle field is not detectable. The speckle knife edge detector (SKED) ‘splits’ the incident speckles into left/right channels across its detector array, allowing it to detect the small deflections in the speckle field. |
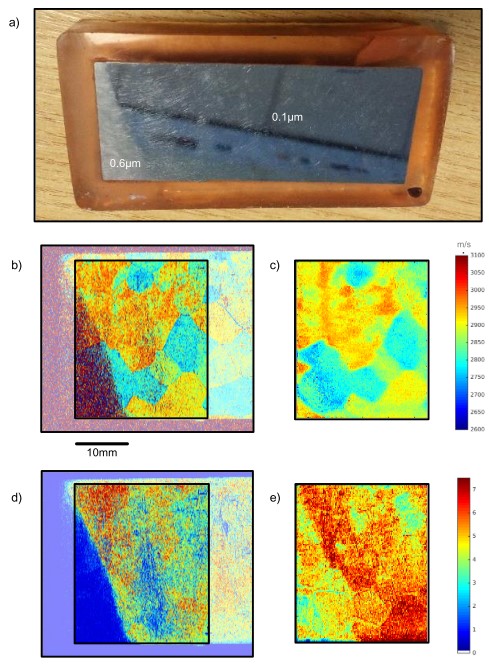 A large grain Ti6246 block (a) was scanned using both the smooth surface SRAS setup and rough surface SRAS setup. The values shown in (a) indicates the roughness (in Ra) in that area of the sample. The measured SAW velocity (m/s) of the sample is shown in (b) using the smooth surface setup (c) using the rough surface setup. A box in (b) indicates the area of the sample that were scanned using both systems. Images (d,e) show the maximum signal amplitude (arb. units) detected using the smooth and rough surface setups respectively—both images show a decrease in response in the rougher region (which supports the findings from the previous experiment), however, a measurable signal is still observable when using the rough surface setup in the rough region. |
This overall progression in SRAS was translated to AM using a benchtop system as photographed below. The rough surface data illustrated here was a milestone in the SRAS AM journey. The AM sample inspected was manufactured using a Renishaw AM250 and Ti64 powder. Its surface was measured using an Alicona infinite focus microscope to have a Sa of 6.11 µm (a fair representation of current build quality). A SRAS inspection was carried out on the as-deposited surface of this sample at an acoustic wavelength of 250 µm.
 A photograph of the rough-surface SRAS setup showing key component and the laser beam paths. The reflected speckles are captured through a large 50.8 mm lens, with the pattern imaged onto the SKED chip array. Precise control of the detection beam focus is required to ensure the speckles appear larger than two photodetectors on the SKED—this is confirmed by using observing configuration pattern of the SKED device via a USB output. |
 (left) Optical micrograph of the Ti64 SLM sample (right) SRAS velocity map of a 3 mm × 5 mm area on the Ti64 SLM sample. The sample was scanned using a step size of 25 µm in both directions, therefore the image produced is oversampled. In areas where a low or no signal is measured, it is coloured grey. Similar features can be seen in both images, which includes surface cavities and the line mark. |
The next step in the process of integrating SRAS into an AM build platform was a proof of concept system. Here the rough surface SRAS system discussed above was installed on top of a Renishaw AM250 build chamber. The SRAS laser train was delivered into the build chamber via an f-theta lens and translated across the surface using a glavo mirrors - both optical components that are commonly used in SLM build platforms. This prototype system demonstrated the capability of SRAS instrument to work alongside an SLM build laser train.
The short video linked below demonstrates how this worked within a typical workshop as a class 1 laser safe system.
Some ongoing work in this area involves the construction and optimisation of a compact lab-based rough surface SRAS system, which still incorporates the galvo mirrors and f-theta lens brought across from the SLM build chamber prototype system. Rough surfaces systems have and continue to capture velocity maps from AM surfaces of a variety of process and quality. Such a system is now an good candicate for full integration withing a function AM system. We have developed a framework to assess the temporal impact of SRAS, compared to other inspection systems, for SLM manufacture. This framework can be tailored to minimic real-life build specimens and parameters, providing information on the SRAS scan stategy to minimse impact on build time whilst maximising infromation civerage in key areas. This goes hand-in-hand with work on dynamic resolution and critical area detection. In future, by incorporating the SRAS instrument into the SLM build machine, it shall be possible to image 3D renders both defects and the microstructure on a layer-by-layer basis allowing tailoring of the microsturture, on the fly adjustment of build parmaters and correction of defective parts.
At the time of writing two dovetailed challenges remain. 1. Extracting ever greater information on the microstucture and other mechanical properties of specimens with grain size below the spatial reosltuon of the instrument. 2. Greatly increasing the spatial resolution of SRAS (orders of magnitude - beyond simple optical adjustments), to enable full orientation to be recovered in specimens with small grain sizes. In relation to the first point, investigations into high-silicon steel have allowed SAW velcoity maps to be correlated to magnetic anisotropy of SLM components, and the build pattern. To improve the spatial reolution, picosecond pump-probe tecnqiues are under testing for nano-scale microstucture imaging.
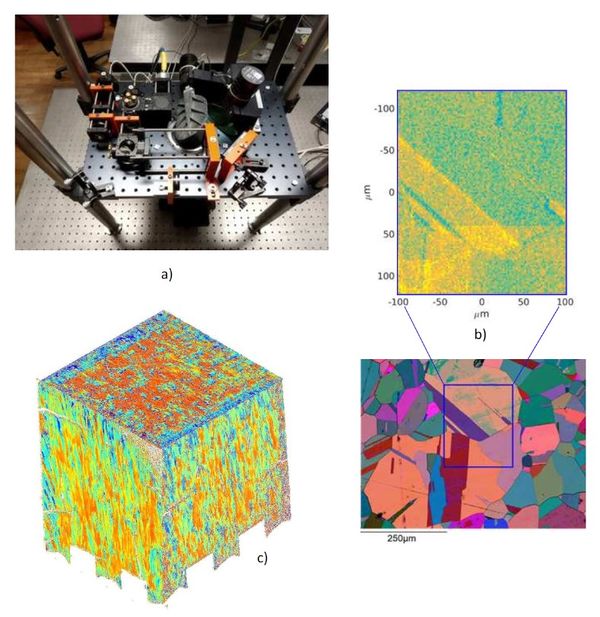 (a) Photograph of the new rough surface SRAS setup mounted on an optical plate,(b) an image taken using a picosecond laser ultrasound setup to map microstructure at the sub-micron level, (c) an isometric SRAS image of high silicon steel showing the direction of columnar grains off three prepared surfaces. |
Research Team
Adam Clare, Matt Clark, Richard Smith, Wenqi Li, Rikesh Patel, Rafael Fuentes Dominguez, Don Pieris and Paul Dryburgh are actively working on this project. Previous contributors include Steve Sharples, Matthias Hirsch and Samuel Osei Achamfuo-Yeboah.
Related Publications and Talks
Publications
R. J. Smith, M. Hirsch, P. Patel, W. Li, A. T. Clare, S. D. Sharples - Spatially resolved acoustic spectroscopy for selective laser melting- Journal of Materials Processing Technology 236:93--102,2016
- https://www.sciencedirect.com/science/article/pii/S0924013616301352
BibtexAuthor : R. J. Smith, M. Hirsch, P. Patel, W. Li, A. T. Clare, S. D. Sharples
Title : Spatially resolved acoustic spectroscopy for selective laser melting
In : Journal of Materials Processing Technology -
Address :
Date : 2016
M. Hirsch, R. Patel, W. Li, G. Guan, R. K. Leach, S. D. Sharples, A. T. Clare - Assessing the capability of in-situ nondestructive analysis during layer based additive manufacture
- Additive Manufacturing 13:135--142,2017
- https://www.sciencedirect.com/science/article/pii/S2214860416301877
BibtexAuthor : M. Hirsch, R. Patel, W. Li, G. Guan, R. K. Leach, S. D. Sharples, A. T. Clare
Title : Assessing the capability of in-situ nondestructive analysis during layer based additive manufacture
In : Additive Manufacturing -
Address :
Date : 2017
M. Hirsch, S. Catchpole-Smith, R. Patel, P. Marrow, W. Li, C. Tuck, S. D. Sharples, A. T. Clare - Meso-scale defect evaluation of selective laser melting using spatially resolved acoustic spectroscopy
- Proc. R. Soc. A 473(2205):170--194,2017
- http://rspa.royalsocietypublishing.org/content/473/2205/20170194
BibtexAuthor : M. Hirsch, S. Catchpole-Smith, R. Patel, P. Marrow, W. Li, C. Tuck, S. D. Sharples, A. T. Clare
Title : Meso-scale defect evaluation of selective laser melting using spatially resolved acoustic spectroscopy
In : Proc. R. Soc. A -
Address :
Date : 2017
M. Hirsch, P. Dryburgh, R. Patel, S. Catchpole-Smith, L. Perry, S. D. Sharples, I. A. Ashcroft, A. T. Clare - Targeted rework strategies for powder bed additive manufacture
- Additive Manufacturing 19:127-133,2018
- https://www.sciencedirect.com/science/article/pii/S2214860417303925
BibtexAuthor : M. Hirsch, P. Dryburgh, R. Patel, S. Catchpole-Smith, L. Perry, S. D. Sharples, I. A. Ashcroft, A. T. Clare
Title : Targeted rework strategies for powder bed additive manufacture
In : Additive Manufacturing -
Address :
Date : 2018
R. Patel, M. Hirsch, P. Dryburgh, D. Pieris, S. Achamfuo-Yeboah, R. Smith, R. Light, S.D. Sharples, A.T. Clare, Matt Clark - Imaging Material Texture of As-Deposited Selective Laser Melted Parts Using Spatially Resolved Acoustic Spectroscopy
- Applied Sciences 8(10):1991,2018
- https://www.mdpi.com/2076-3417/8/10/1991
BibtexAuthor : R. Patel, M. Hirsch, P. Dryburgh, D. Pieris, S. Achamfuo-Yeboah, R. Smith, R. Light, S.D. Sharples, A.T. Clare, Matt Clark
Title : Imaging Material Texture of As-Deposited Selective Laser Melted Parts Using Spatially Resolved Acoustic Spectroscopy
In : Applied Sciences -
Address :
Date : 2018
D. Pieris, R. Patel, P. Dryburgh, M. Hirsch, W. Li, S. Sharples, R.J. Smith, A.T. Clare, M. Clark - Spatially resolved acoustic spectroscopy towards online inspection of additive manufacturing
- Insight - Non-Destructive Testing & Condition Monitoring 61(3):132-137,2019
- BibtexAuthor : D. Pieris, R. Patel, P. Dryburgh, M. Hirsch, W. Li, S. Sharples, R.J. Smith, A.T. Clare, M. Clark
Title : Spatially resolved acoustic spectroscopy towards online inspection of additive manufacturing
In : Insight - Non-Destructive Testing & Condition Monitoring -
Address :
Date : 2019
P. Dryburgh, D. Pieris, F.Martina, R. Patel, S. Sharples, W. Li, A.T. Clare, S. Williams, R.J. Smith - Spatially Resolved Acoustic Spectroscopy for Integrity Assessment in Wire-Arc Additive Manufacturing
- Additive Manufacturing 28(C):236-251,2019
- BibtexAuthor : P. Dryburgh, D. Pieris, F.Martina, R. Patel, S. Sharples, W. Li, A.T. Clare, S. Williams, R.J. Smith
Title : Spatially Resolved Acoustic Spectroscopy for Integrity Assessment in Wire-Arc Additive Manufacturing
In : Additive Manufacturing -
Address :
Date : 2019
P. Dryburgh, R. Patel, D. M. Pieris, M. Hirsch, W. Li, S. D. Sharples, R. J. Smith, A. T. Clare, M. Clark - Spatially resolved acoustic spectroscopy for texture imaging in powder bed fusion nickel superalloys
- AIP Conference Proceedings 2102(1):020004,2019
- BibtexAuthor : P. Dryburgh, R. Patel, D. M. Pieris, M. Hirsch, W. Li, S. D. Sharples, R. J. Smith, A. T. Clare, M. Clark
Title : Spatially resolved acoustic spectroscopy for texture imaging in powder bed fusion nickel superalloys
In : AIP Conference Proceedings -
Address :
Date : 2019
D. Pieris, T. Stratoudaki, Y. Javadi, P. Lukacs, S. Catchpole-Smith, P. D. Wilcox, A. Clare, M. Clark - Laser Induced Phased Arrays (LIPA) to detect nested features in additively manufactured components
- Materials & Design 187(108412),2020
- BibtexAuthor : D. Pieris, T. Stratoudaki, Y. Javadi, P. Lukacs, S. Catchpole-Smith, P. D. Wilcox, A. Clare, M. Clark
Title : Laser Induced Phased Arrays (LIPA) to detect nested features in additively manufactured components
In : Materials & Design -
Address :
Date : 2020
L. Bai, A. Velichko, A. T. Clare, P. Dryburgh, D. Pieris, B. W. Drinkwater - The effect of distortion models on characterisation of real defects using ultrasonic arrays
- NDT & E International 113(102263),2020
- BibtexAuthor : L. Bai, A. Velichko, A. T. Clare, P. Dryburgh, D. Pieris, B. W. Drinkwater
Title : The effect of distortion models on characterisation of real defects using ultrasonic arrays
In : NDT & E International -
Address :
Date : 2020
Conference Papers
S. D. Sharples, R. A. Light, S. O. Achamfuo-Yeboah, M. Clark, M. G. Somekh - The SKED: Speckle Knife Edge Detector
- 3rd International Symposium on Laser-Ultrasonics and Advanced Sensing, Yokohama, Japan 581,2013
- http://iopscience.iop.org/article/10.1088/1742-6596/520/1/012004
BibtexAuthor : S. D. Sharples, R. A. Light, S. O. Achamfuo-Yeboah, M. Clark, M. G. Somekh
Title : The SKED: Speckle Knife Edge Detector
In : 3rd International Symposium on Laser-Ultrasonics and Advanced Sensing, Yokohama, Japan -
Address :
Date : 2013
S. O. Achamfuo-Yeboah, R. A. Light, S. D Sharples - Optical detection of ultrasound from optically rough surfaces using a custom CMOS sensor
- 13th Anglo-French Physical Acoustics Conference (AFPAC2014) 581,2014
- http://iopscience.iop.org/article/10.1088/1742-6596/581/1/012009/meta
BibtexAuthor : S. O. Achamfuo-Yeboah, R. A. Light, S. D Sharples
Title : Optical detection of ultrasound from optically rough surfaces using a custom CMOS sensor
In : 13th Anglo-French Physical Acoustics Conference (AFPAC2014) -
Address :
Date : 2014
P. Dryburgh, R. Patel, S. Catchpole-Smith, M. Hirsch, L. Perry, R. J. Smith, M. Clark, I. A. Ashcroft, A. T. Clare - Targeted rework of powder bed fusion additive manufacturing
- Proceedings of LPM2018 - the 19th International Symposium on Laser Precision Microfabrication ,2018
- https://nottingham-repository.worktribe.com/output/1190715/targeted-rework-of-powder-bed-fusion-additive-manufacturing
BibtexAuthor : P. Dryburgh, R. Patel, S. Catchpole-Smith, M. Hirsch, L. Perry, R. J. Smith, M. Clark, I. A. Ashcroft, A. T. Clare
Title : Targeted rework of powder bed fusion additive manufacturing
In : Proceedings of LPM2018 - the 19th International Symposium on Laser Precision Microfabrication -
Address :
Date : 2018
D. M.Pieris, R. Patel, P. Dryburgh, M. Hirsch, W. Li, S. D. Sharples, R. J. Smith, A. T. Clare, M. Clark - Spatially resolved acoustic spectroscopy additive manufacturing: towards online inspection
- Proceedings of BINDT2018 - the 57th Annual British Conference on Non-Destructive Testing ,2018
- https://nottingham-repository.worktribe.com/output/1191130/spatially-resolved-acoustic-spectroscopy-additive-manufacturing-towards-online-inspection
BibtexAuthor : D. M.Pieris, R. Patel, P. Dryburgh, M. Hirsch, W. Li, S. D. Sharples, R. J. Smith, A. T. Clare, M. Clark
Title : Spatially resolved acoustic spectroscopy additive manufacturing: towards online inspection
In : Proceedings of BINDT2018 - the 57th Annual British Conference on Non-Destructive Testing -
Address :
Date : 2018
- 15th Anglo-French Physical Acoustics Conference, Fréjus, France ,2015
- BibtexAuthor : Patel Rikesh, Guan Guanying, Hirsch Matthias, Li Wenqi, Smith Richard J., Achamfuo-Yeboah Samual, Light Roger A., Clare Adam T., Tuck Chris, Clark Matt, Sharples Steve D.
Title : On using laser ultrasonic non-destructive evaluation for additive manufactured samples
In : 15th Anglo-French Physical Acoustics Conference, Fréjus, France -
Address :
Date : 2015
Clare Adam T., Sharples Steve D., Tuck Chris, Groom Kristian, Hirsch Matthias, Patel Rikesh, Li Wenqi, Smith Richard J., Guan Guanying - In-Process monitoring of Additive Layer Manufacturing
- 54th Annual Conference of The British Institute of Non-Destructive Testing, Telford, UK ,2015
- BibtexAuthor : Clare Adam T., Sharples Steve D., Tuck Chris, Groom Kristian, Hirsch Matthias, Patel Rikesh, Li Wenqi, Smith Richard J., Guan Guanying
Title : In-Process monitoring of Additive Layer Manufacturing
In : 54th Annual Conference of The British Institute of Non-Destructive Testing, Telford, UK -
Address :
Date : 2015
Patel Rikesh, Hirsch Matthias, Li Wenqi, Smith Richard J., Achamfuo-Yeboah Samual, Tuck Chris, Clark Matt, Clare Adam T., Sharples Steve D. - On using laser ultrasonic non-destructive evaluation for additive manufactured samples
- 4th International Symposium on Laser-Ultrasonics and Advanced Sensing, Illinois, USA ,2015
- BibtexAuthor : Patel Rikesh, Hirsch Matthias, Li Wenqi, Smith Richard J., Achamfuo-Yeboah Samual, Tuck Chris, Clark Matt, Clare Adam T., Sharples Steve D.
Title : On using laser ultrasonic non-destructive evaluation for additive manufactured samples
In : 4th International Symposium on Laser-Ultrasonics and Advanced Sensing, Illinois, USA -
Address :
Date : 2015
Patel Rikesh, Hirsch Matthias, Li Wenqi, Smith Richard J., Achamfuo-Yeboah Samual, Tuck Chris, Clark Matt, Clare Adam T., Sharples Steve D. - On using laser ultrasonic non-destructive evaluation for additive manufactured samples
- 42nd Annual Review of Progress in Quantitative Nondestructive Evaluation Conference, Minneapolis, USA ,2015
- BibtexAuthor : Patel Rikesh, Hirsch Matthias, Li Wenqi, Smith Richard J., Achamfuo-Yeboah Samual, Tuck Chris, Clark Matt, Clare Adam T., Sharples Steve D.
Title : On using laser ultrasonic non-destructive evaluation for additive manufactured samples
In : 42nd Annual Review of Progress in Quantitative Nondestructive Evaluation Conference, Minneapolis, USA -
Address :
Date : 2015
Patel Rikesh, Hirsch Matthias, Smith Richard J., Achamfuo-Yeboah Samual, Clare Adam T., Sharples Steve D. - Laser ultrasonic inspection of as-deposited AM samples
- 5th International Symposium on Laser-Ultrasonics and Advanced Sensing, Linz, Austria ,2016
- BibtexAuthor : Patel Rikesh, Hirsch Matthias, Smith Richard J., Achamfuo-Yeboah Samual, Clare Adam T., Sharples Steve D.
Title : Laser ultrasonic inspection of as-deposited AM samples
In : 5th International Symposium on Laser-Ultrasonics and Advanced Sensing, Linz, Austria -
Address :
Date : 2016
Clare Adam T., Sharples Steve D., Leach Richard K., Guan Guanying, Hirsch Matthias, Patel Rikesh - In-Process monitoring of Additive Layer Manufacturing
- 66th CIRP General Assembly, Guimarães, Portugal ,2016
- BibtexAuthor : Clare Adam T., Sharples Steve D., Leach Richard K., Guan Guanying, Hirsch Matthias, Patel Rikesh
Title : In-Process monitoring of Additive Layer Manufacturing
In : 66th CIRP General Assembly, Guimarães, Portugal -
Address :
Date : 2016
Clare Adam T., Hirsch Matthias, Guan Guanying, Patel Rikesh, Li Wenqi, Dryburgh Paul, Milesh Pieris Don, Sharples Steve D. - Approaches for AM in-process inspection using SRAS and OCT
- EUSPEN Special Interest Group Meeting: Quality Control for Additive Manufacturing, Coventry, UK ,2017
- BibtexAuthor : Clare Adam T., Hirsch Matthias, Guan Guanying, Patel Rikesh, Li Wenqi, Dryburgh Paul, Milesh Pieris Don, Sharples Steve D.
Title : Approaches for AM in-process inspection using SRAS and OCT
In : EUSPEN Special Interest Group Meeting: Quality Control for Additive Manufacturing, Coventry, UK -
Address :
Date : 2017
Pieris Don M., Catchpole-Smith Sam, Patel Rikesh, Hirsch Matthias, Dryburgh Paul, Li Wenqi, Sharples Steve D., Smith Richard, Clare Adam T., Clark Matt - Detection and Manipulation of AM Component Microstructure using SRAS
- Institute of Physics: Optics and Ultrasound IV, University of Strathclyde, UK ,2017
- BibtexAuthor : Pieris Don M., Catchpole-Smith Sam, Patel Rikesh, Hirsch Matthias, Dryburgh Paul, Li Wenqi, Sharples Steve D., Smith Richard, Clare Adam T., Clark Matt
Title : Detection and Manipulation of AM Component Microstructure using SRAS
In : Institute of Physics: Optics and Ultrasound IV, University of Strathclyde, UK -
Address :
Date : 2017
Clare Adam T., Dryburgh Paul, Pieris Don M., Patel Rikesh, and Li Wenqi, Smith Richard, Clark Matt - Finding and Fixing Defects in Metal Powder Bed Systems
- Manufacture using Advanced Powder Processes: 1st International Conference ,2018
- BibtexAuthor : Clare Adam T., Dryburgh Paul, Pieris Don M., Patel Rikesh, and Li Wenqi, Smith Richard, Clark Matt
Title : Finding and Fixing Defects in Metal Powder Bed Systems
In : Manufacture using Advanced Powder Processes: 1st International Conference -
Address :
Date : 2018
Pieris Don M. - LIPA for AM
- QNDE: 47th Annual Review of Progress in Quantitative Nondestructive Evaluation ,2019
- BibtexAuthor : Pieris Don M.
Title : LIPA for AM
In : QNDE: 47th Annual Review of Progress in Quantitative Nondestructive Evaluation -
Address :
Date : 2019
Patel Rikesh - SRAS for AM
- International Congress on Ultrasound 2019 ,2019
- BibtexAuthor : Patel Rikesh
Title : SRAS for AM
In : International Congress on Ultrasound 2019 -
Address :
Date : 2019
Pieris Don M. - LIPA for AM
- International Congress on Ultrasound 2019 ,2019
- BibtexAuthor : Pieris Don M.
Title : LIPA for AM
In : International Congress on Ultrasound 2019 -
Address :
Date : 2019
Dryburgh Paul - Materials characterisation in AM with SRAS
- 15th Nondestructive Characterisation of Materials Conference ,2019
- BibtexAuthor : Dryburgh Paul
Title : Materials characterisation in AM with SRAS
In : 15th Nondestructive Characterisation of Materials Conference -
Address :
Date : 2019
