Difference between revisions of "Cell Imaging Using Picosecond Ultrasonics"
(→Instrument) |
(→Related Publications and Talks) |
||
| (57 intermediate revisions by 2 users not shown) | |||
| Line 1: | Line 1: | ||
==Motivation== | ==Motivation== | ||
| + | This project aims to develop an instrument for imaging cells using their mechanical properties as a contrast mechanism and with high resolution. The goal is to design and build a microscopy system that can be used as a general microscopy tool for cell biologists. | ||
| − | + | To map the elasticity of cells with optical or higher resolution is very challenging. Ultrasound is a way to image with contrast derived from elasticity however, to obtain high resolution imaging this way necessitates phonons (GHz frequency ultrasound). To work at this regime poses many challenges: phonon generation requires laser light and heat which can damage cells, at GHz frequencies the phonons do not travel very far and the pump-probe detection method is typically low in signal-to-noise ratio and slow in acquisition speed. | |
| − | |||
| − | + | If all those challenges are solved, then there can be potentially greater benefits: the energy carried by phonons is orders of magnitude lower than that of light, which is suitable for live-cell imaging and allows to use arbitrarily small wavelengths for imaging leading to super-resolution. The contrast mechanism does not require the use of dyes so its label-free and of course it will provide means to image cells based on elasticity at a resolution never achieved before. | |
| − | + | ==Detection mechanism - Brillouin scattering in transmission== | |
| − | + | [[Image:Brillouin simple.png|250px|right]] | |
| − | [[Image:Brillouin simple.png| | ||
| − | |||
| − | The | + | To solve some of the challenges of phonon imaging on cells, a novel detection configuration is being developed. In this configuration, an inverted microscope is used to deliver the pump and probe laser beams through the substrate where an opto-acoustic transducer converts pump light into a coherent phonon field while protecting the cells against unnecessary exposure to pump-light(UVA) and heat. The transmitted probe light (NIR) interacts with the generated phonon-field via Brillouin scattering which is collected and detected for imaging. Since the phonon field is propagating through the sample, its velocity and amplitude is related to the sample's elasticity. |
| − | |||
| − | + | To detect the phonon field the scattered light interferes with the directly propagating light at the detector leading to an oscillating signal. These oscillations are termed Brillouin Oscillations and the Brillouin frequency ''f_B'' of the oscillation is given by the simple equation: ''f_B = 2*Va*n/λ'' which relates the acoustic velocity ''Va'' with the probe wavelength ''λ'' and the refractive index ''n''. | |
<br style="clear:both" /> | <br style="clear:both" /> | ||
| Line 28: | Line 25: | ||
|} | |} | ||
| − | + | The cells are grown on a transducer substrate similar to those described [[Nanoscale_Ultrasonic_Transducers|here]]. The optimization of the transducer layer in this case has the purpose to facilitate detection of Brillouin scattering in transmission and protecting the cells against pump light and heat. This is achieved by using an optical cavity/mechanical cavity as an opto-acoustic transducer. The cavity is designed to have maximum transmission at the probe wavelength while minimum at the pump wavelength. The cavity also is designed to resonate at the desired frequency for optimized SNR. Finally heat is managed through the use of a high thermal-conductivity substrate. | |
| + | |||
| + | <br style="clear:both" /> | ||
| + | |||
| + | ==Instrumentation == | ||
| + | [[file:BNC_ASOPS_Layout.jpg|250px|right|alt=alt text|ASOPS pump probe instrument]] | ||
| + | Measurements are made using a pump/probe picosecond laser ultrasound instrument utilizing ASOPS lasers. These laser control the delay between the pulse electronically removing the need to mechanically scan a delay line. This allows the very small signals present in these typos of experiments to be obtained quickly. | ||
| + | The pump beam is frequency doubled using a nonlinear crystal to give a wavelength of 390nm, the probe beam is at 780nm and both beams can be directed to the sample through and objective lens normal to the sample. optionally the pump beam can also be directed to the underside of the sample to generate the acoustic waves from below. | ||
| + | |||
| + | The instrument also has optical paths for wide field phase contrast imaging to allow the cells being studied to be visualized. This allows us to assess the cells health and locate the scan region of most interest. | ||
| + | |||
| + | The acoustic signals are captured by recording the probe beam power with a photo-diode, this signal is then filtered and amplified before being digitized with a digital oscilloscope. To build up an image the sample is raster scanned. | ||
<br style="clear:both" /> | <br style="clear:both" /> | ||
| − | == | + | ==Ultrasonic imaging of cells== |
| − | {|class="wikitable" align=" | + | An example of an experimental trace obtained using a glass substrate is shown below, there are three main components present in the signal: A signal from the transducer resonance, one from Brillouin oscillations in the glass, and one from the cell or media. These signals are all clearly separated in the the frequency domain as shown by the FFT. |
| + | {|class="wikitable" align="" | ||
| + | |- | ||
| + | |[[Image:PLU_sample_trace_filtered.png |300px|alt=alt text|Typical signal]] | ||
| + | |[[Image:PLU_sample_trace_fft.png |300px|alt=alt text|Cell outline]] | ||
| + | |} | ||
| + | |||
| + | <br style="clear:both" /> | ||
| + | |||
| + | ===Fixed Cells=== | ||
| + | By recording the Brillouin frequency while scanning the sample images can be taken. The below shows a Brillouin frequency map of a fixed fibroblast cell, this image shows the location of the nucleus (the redder region). | ||
| + | {|class="wikitable" align="" | ||
| + | |- | ||
| + | |[[Image:PLU_fixedCell1.png |300px|alt=alt text|image of cell]] | ||
| + | |[[Image:PLU_fixedBrillouin1.png |300px|alt=alt text|Brillouin image of cell]] | ||
| + | |} | ||
| + | A different fibroblast cell is shown below, here we can see much more detail, with the filopodia clearly visible. | ||
| + | {|class="wikitable" align="" | ||
|- | |- | ||
| − | |[[Image: | + | |[[Image:PLU_fixedCell2.png |300px|alt=alt text|image of cell]] |
| + | |[[Image:PLU_fixedBrillouin2.png |300px|alt=alt text|Brillouin image of cell]] | ||
| + | |} | ||
| + | The image below shows a scan of a fixed cardiac cell, the striations of the cell are clearly visible, these repeating structures are how the cells contract, and have spacings on the order of a few microns. | ||
| + | {|class="wikitable" align="" | ||
|- | |- | ||
| − | |[[Image: | + | |[[Image:PLU_cardiacOptical.png |300px|alt=alt text|image of cell]] |
| + | |[[Image:PLU_cardiacBrill.png |300px|alt=alt text|Brillouin image of cardiac cell]] | ||
|} | |} | ||
<br style="clear:both" /> | <br style="clear:both" /> | ||
| − | ==Publications and Talks== | + | ===Live Cells=== |
| − | IOP | + | Measuring live cells is much more challenging, this is because the amount of light they can tolerate without being affected is much lower than the amount that would damage fixed cells. Secondly the cells can move around and so the scans need to be taken as quickly as possible. |
| − | + | ||
| + | {|class="wikitable" align="" | ||
| + | |- | ||
| + | |[[Image:PLU_liveLineBrill2A.png |150px|alt=alt text|scan cell A]] | ||
| + | |[[Image:PLU_liveLineBrill2B.png |150px|alt=alt text|scan cell B]] | ||
| + | |[[Image:PLU_liveLineBrill2C.png |150px|alt=alt text|scan cell C]] | ||
| + | |[[Image:PLU_liveLineOptical2_FluorAfter.png |300px|alt=alt text|Resonant Frequency]] | ||
| + | |} | ||
| + | |||
| + | |||
| + | {|class="wikitable" align="" | ||
| + | |- | ||
| + | |[[Image:PLU_Brillouin_mapl_exp2.png |150px|alt=alt text|scan cell A]] | ||
| + | |[[Image:PLU_Himag_before_exp2.png |150px|alt=alt text|scan cell B]] | ||
| + | |} | ||
| + | |||
| + | ==3D imaging== | ||
| + | It is possible to use signal processing techniques to extract more information from the data we obtain during the scans. By analyzing the frequency of the signal vs time we can extract changes in frequency with depth. This enables the mapping of internal structures in the cells, or should the acoustic waves leave the cell and enter the medium it allows us to obtain the profile. | ||
| + | |||
| + | There are a number of different ways to do this, from relatively fast and simple methods (zero cross analysis) to more complex approaches (wavelets). | ||
| + | |||
| + | Below is an example of the process for a phantom cell made from polystyrene beads. In the time trace the transition from the phantom back to the media is clearly visible. | ||
| + | |||
| + | [[Image:PLU_transition_samplett.png |300px|alt=alt text|trace of phantom cell]] | ||
| + | |||
| + | If we take the Brillouin frequency map and a map of the refractive index we can produce a map of the acoustic velocity of the material. | ||
| + | |||
| + | {|class="wikitable" align="" | ||
| + | |- | ||
| + | |[[Image:PLU_phantom2brillTrans.png |300px|alt=alt text|Brillouin Freq]] | ||
| + | |[[Image:PLU_phantomNMap.png |300px|alt=alt text|index map]] | ||
| + | |[[Image:PLU_phantomSpeedMap.png |300px|alt=alt text|velocity map]] | ||
| + | |} | ||
| + | Combining this map with the transition time information gives us the profile of the cell phantom. | ||
| + | |||
| + | [[Image:PLU_phantom_profile.png |400px|alt=alt text|trace of phantom cell]] | ||
| + | |||
| + | ==Related Publications and Talks== | ||
| + | |||
| + | ===Publications:=== | ||
| + | |||
| + | '''Cell imaging by phonon microscopy: sub-optical wavelength ultrasound for non-invasive imaging'''. Fernando Perez-Cota et al, Imaging & Microscopy 2017 (3). | ||
| + | |||
| + | '''High resolution imaging of living cells with sub-optical wavelength phonons''' Perez-Cota F., Smith R. J. Moradi E., Marques L., Webb K, and Clark M. Scientific Reports. | ||
| + | |||
| + | '''Thin film transdcuers for subcellular Brillouin oscillation imaging of individual biological cells''', Perez-Cota F., Smith R. J. Moradi E., Marques L., Webb K, and Clark M.,Appl. Opts. 54 28 (2015) | ||
| + | |||
| + | '''Optically excited nanoscaled ultrasonic transducers''', Smith R. J. , Perez-Cota F., Marques L., Xuesheng C., Ahmet A., Webb K, Aylott J., Somekh M. G. and Clark M., JASA 137 1 (2015) | ||
| + | |||
| + | |||
| + | ===Proceedings:=== | ||
| + | |||
| + | '''Cell imaging with sub-optical wavelength ultrasound'''. Clark M., Marques L., Moradi E.,Perez-Cota F., Smith R. J., and Webb K. Asia Communications and Photonics Conference (2015). | ||
| + | |||
| + | '''Thin-film transducers for the detection and imaging of Brillouin oscillations in transmission on cultured cells'''. Perez-Cota F., Smith R. J. Moradi E., Webb K, and Clark M.,JPCS AFPAC (2015) | ||
| + | |||
| + | '''Sound of nano''' J. Aylott, M. Clark, L. Marques, F. Perez-Cota, R.J. Smith and K. F. Webb. SPIE 8923, Micro/Nano Materials, Devices, and Systems Proceedings (2013). | ||
| + | |||
| + | |||
| + | ===Talks:=== | ||
| + | |||
| + | Cell investigations using picosecond laser ultrasound imaging Perez-Cota F., Smith R. J. Moradi E., Webb K, and Clark M. '''LU Linz Austria (2016)''' oral presentation. | ||
| + | |||
| + | Cell imaging based on Brillouin oscillations detection in transmission using thin-film transducers Perez-Cota F., Smith R. J. Moradi E., Webb K, and Clark M. '''LU Chicago IL (2015)''' oral presentation. | ||
| + | |||
| + | Design and application of nano-scaled ultrasonic transducers F. Perez Cota, R.J. Smith, L. Marques, K. F. Webb and M. Clark. '''RCNDE ERS Glasgow (2014)''', oral presentation. | ||
| + | |||
| + | Nano-scale transducers for picosecond ultrasonics in living cells F Perez Cota, R. J.Smith, K. F. Webb and M. Clark. '''LU Yokohama Japan (2013)''' oral presentation. | ||
| + | |||
| + | Design and application of nano-scaled transducers R. J. Smith, F. Perez Cota, L. Marques, K. F. Webb and M. Clark. '''IOP Optics and Ultrasound day''' meeting at The University of Nottingham (2013), oral presentation. | ||
| + | |||
| + | Nano-scale transducers for picosecond ultrasound in living cells F Perez Cota, R. J. Smith, K. F. Webb and M. Clark. '''AFPAC (2013)''' oral presentation. | ||
Latest revision as of 11:02, 18 July 2018
Contents
Motivation
This project aims to develop an instrument for imaging cells using their mechanical properties as a contrast mechanism and with high resolution. The goal is to design and build a microscopy system that can be used as a general microscopy tool for cell biologists.
To map the elasticity of cells with optical or higher resolution is very challenging. Ultrasound is a way to image with contrast derived from elasticity however, to obtain high resolution imaging this way necessitates phonons (GHz frequency ultrasound). To work at this regime poses many challenges: phonon generation requires laser light and heat which can damage cells, at GHz frequencies the phonons do not travel very far and the pump-probe detection method is typically low in signal-to-noise ratio and slow in acquisition speed.
If all those challenges are solved, then there can be potentially greater benefits: the energy carried by phonons is orders of magnitude lower than that of light, which is suitable for live-cell imaging and allows to use arbitrarily small wavelengths for imaging leading to super-resolution. The contrast mechanism does not require the use of dyes so its label-free and of course it will provide means to image cells based on elasticity at a resolution never achieved before.
Detection mechanism - Brillouin scattering in transmission
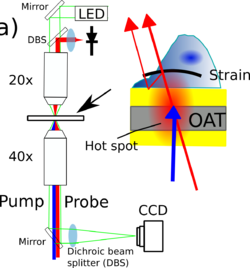
To solve some of the challenges of phonon imaging on cells, a novel detection configuration is being developed. In this configuration, an inverted microscope is used to deliver the pump and probe laser beams through the substrate where an opto-acoustic transducer converts pump light into a coherent phonon field while protecting the cells against unnecessary exposure to pump-light(UVA) and heat. The transmitted probe light (NIR) interacts with the generated phonon-field via Brillouin scattering which is collected and detected for imaging. Since the phonon field is propagating through the sample, its velocity and amplitude is related to the sample's elasticity.
To detect the phonon field the scattered light interferes with the directly propagating light at the detector leading to an oscillating signal. These oscillations are termed Brillouin Oscillations and the Brillouin frequency f_B of the oscillation is given by the simple equation: f_B = 2*Va*n/λ which relates the acoustic velocity Va with the probe wavelength λ and the refractive index n.
Substrate Design
 |
|
 |
|
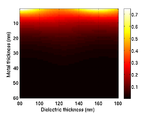
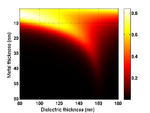
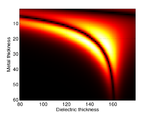
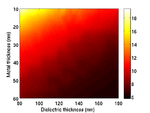
The cells are grown on a transducer substrate similar to those described here. The optimization of the transducer layer in this case has the purpose to facilitate detection of Brillouin scattering in transmission and protecting the cells against pump light and heat. This is achieved by using an optical cavity/mechanical cavity as an opto-acoustic transducer. The cavity is designed to have maximum transmission at the probe wavelength while minimum at the pump wavelength. The cavity also is designed to resonate at the desired frequency for optimized SNR. Finally heat is managed through the use of a high thermal-conductivity substrate.
Instrumentation
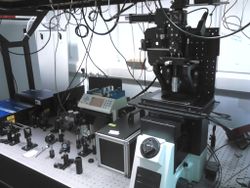
Measurements are made using a pump/probe picosecond laser ultrasound instrument utilizing ASOPS lasers. These laser control the delay between the pulse electronically removing the need to mechanically scan a delay line. This allows the very small signals present in these typos of experiments to be obtained quickly.
The pump beam is frequency doubled using a nonlinear crystal to give a wavelength of 390nm, the probe beam is at 780nm and both beams can be directed to the sample through and objective lens normal to the sample. optionally the pump beam can also be directed to the underside of the sample to generate the acoustic waves from below.
The instrument also has optical paths for wide field phase contrast imaging to allow the cells being studied to be visualized. This allows us to assess the cells health and locate the scan region of most interest.
The acoustic signals are captured by recording the probe beam power with a photo-diode, this signal is then filtered and amplified before being digitized with a digital oscilloscope. To build up an image the sample is raster scanned.
Ultrasonic imaging of cells
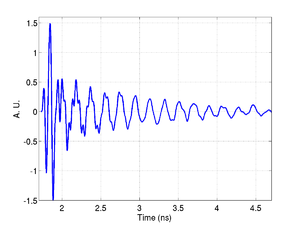
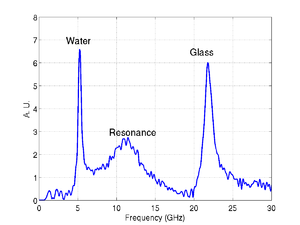
An example of an experimental trace obtained using a glass substrate is shown below, there are three main components present in the signal: A signal from the transducer resonance, one from Brillouin oscillations in the glass, and one from the cell or media. These signals are all clearly separated in the the frequency domain as shown by the FFT.
|
|
Fixed Cells
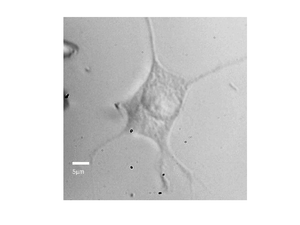
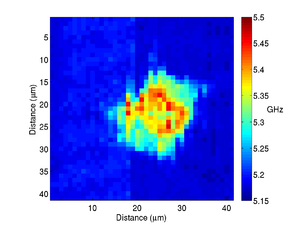
By recording the Brillouin frequency while scanning the sample images can be taken. The below shows a Brillouin frequency map of a fixed fibroblast cell, this image shows the location of the nucleus (the redder region).
|
|
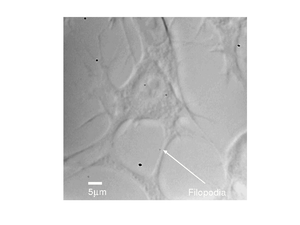
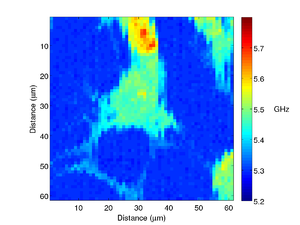
A different fibroblast cell is shown below, here we can see much more detail, with the filopodia clearly visible.
|
|
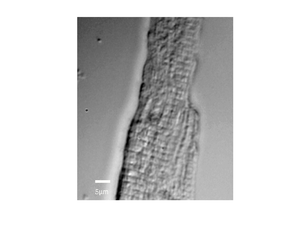
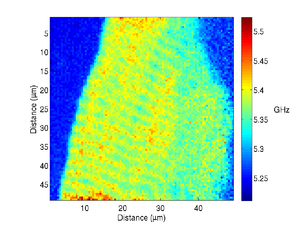
The image below shows a scan of a fixed cardiac cell, the striations of the cell are clearly visible, these repeating structures are how the cells contract, and have spacings on the order of a few microns.
|
|
Live Cells
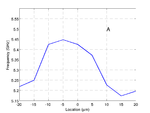
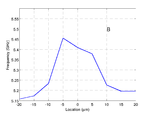
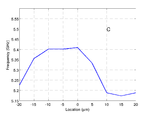
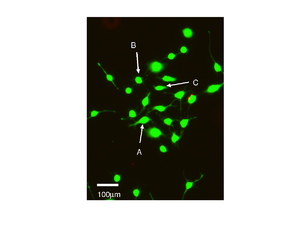
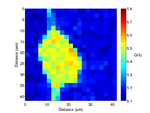
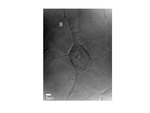
Measuring live cells is much more challenging, this is because the amount of light they can tolerate without being affected is much lower than the amount that would damage fixed cells. Secondly the cells can move around and so the scans need to be taken as quickly as possible.
|
|
|
|
|
|
3D imaging
It is possible to use signal processing techniques to extract more information from the data we obtain during the scans. By analyzing the frequency of the signal vs time we can extract changes in frequency with depth. This enables the mapping of internal structures in the cells, or should the acoustic waves leave the cell and enter the medium it allows us to obtain the profile.
There are a number of different ways to do this, from relatively fast and simple methods (zero cross analysis) to more complex approaches (wavelets).
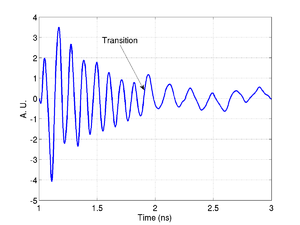
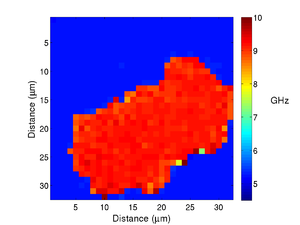
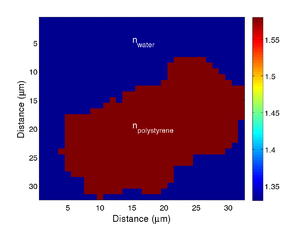
Below is an example of the process for a phantom cell made from polystyrene beads. In the time trace the transition from the phantom back to the media is clearly visible.
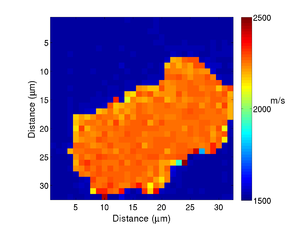
If we take the Brillouin frequency map and a map of the refractive index we can produce a map of the acoustic velocity of the material.
|
|
|
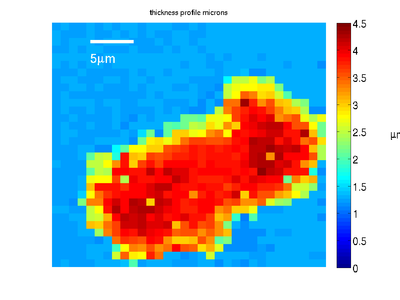
Combining this map with the transition time information gives us the profile of the cell phantom.
Related Publications and Talks
Publications:
Cell imaging by phonon microscopy: sub-optical wavelength ultrasound for non-invasive imaging. Fernando Perez-Cota et al, Imaging & Microscopy 2017 (3).
High resolution imaging of living cells with sub-optical wavelength phonons Perez-Cota F., Smith R. J. Moradi E., Marques L., Webb K, and Clark M. Scientific Reports.
Thin film transdcuers for subcellular Brillouin oscillation imaging of individual biological cells, Perez-Cota F., Smith R. J. Moradi E., Marques L., Webb K, and Clark M.,Appl. Opts. 54 28 (2015)
Optically excited nanoscaled ultrasonic transducers, Smith R. J. , Perez-Cota F., Marques L., Xuesheng C., Ahmet A., Webb K, Aylott J., Somekh M. G. and Clark M., JASA 137 1 (2015)
Proceedings:
Cell imaging with sub-optical wavelength ultrasound. Clark M., Marques L., Moradi E.,Perez-Cota F., Smith R. J., and Webb K. Asia Communications and Photonics Conference (2015).
Thin-film transducers for the detection and imaging of Brillouin oscillations in transmission on cultured cells. Perez-Cota F., Smith R. J. Moradi E., Webb K, and Clark M.,JPCS AFPAC (2015)
Sound of nano J. Aylott, M. Clark, L. Marques, F. Perez-Cota, R.J. Smith and K. F. Webb. SPIE 8923, Micro/Nano Materials, Devices, and Systems Proceedings (2013).
Talks:
Cell investigations using picosecond laser ultrasound imaging Perez-Cota F., Smith R. J. Moradi E., Webb K, and Clark M. LU Linz Austria (2016) oral presentation.
Cell imaging based on Brillouin oscillations detection in transmission using thin-film transducers Perez-Cota F., Smith R. J. Moradi E., Webb K, and Clark M. LU Chicago IL (2015) oral presentation.
Design and application of nano-scaled ultrasonic transducers F. Perez Cota, R.J. Smith, L. Marques, K. F. Webb and M. Clark. RCNDE ERS Glasgow (2014), oral presentation.
Nano-scale transducers for picosecond ultrasonics in living cells F Perez Cota, R. J.Smith, K. F. Webb and M. Clark. LU Yokohama Japan (2013) oral presentation.
Design and application of nano-scaled transducers R. J. Smith, F. Perez Cota, L. Marques, K. F. Webb and M. Clark. IOP Optics and Ultrasound day meeting at The University of Nottingham (2013), oral presentation.
Nano-scale transducers for picosecond ultrasound in living cells F Perez Cota, R. J. Smith, K. F. Webb and M. Clark. AFPAC (2013) oral presentation.
