Difference between revisions of "Cell Imaging Using Picosecond Ultrasonics"
(→3D imaging) |
(→Ultrasonic images of Cells) |
||
| Line 37: | Line 37: | ||
<br style="clear:both" /> | <br style="clear:both" /> | ||
| − | ==Ultrasonic | + | ==Ultrasonic imaging of cells== |
An example trace is shown below, there are three main components present in the signal. | An example trace is shown below, there are three main components present in the signal. | ||
A signal from the transducer substrate, once from Brillouin oscialltions in the glass, and one from the cell or media. These signals are all clearly separated in the the frequency domain as shown by the FFT. | A signal from the transducer substrate, once from Brillouin oscialltions in the glass, and one from the cell or media. These signals are all clearly separated in the the frequency domain as shown by the FFT. | ||
Revision as of 13:06, 5 June 2015
Contents
Motivation
Detection mechanism - Brillouin Oscillations
The probe light is reflected from the sample surface to the detector, and if the sample is transparent there is also a reflection from the acoustic wave packet traveling in the sample. This happens because the acoustic wave causes a change in the local refractive index and so acts as a weak mirror. These reflections interfere at the detector and as the phase of the reflection from the acoustic wave is changing with time it leads to an oscillating signal. These oscillations are termed Brillouin Oscillations.
The frequency F of the oscillation is given by the simple equation: F = 2*Va*n/λ
So if we can measure this signal we can measure the acoustic velocity Va, as long as we know the laser wavelength λ and the refractive index n.
Substrate Design
 |
|
 |
|
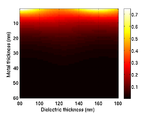
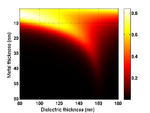
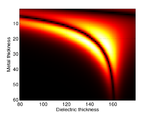
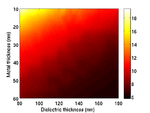
The cells are grown on a transducer substrate similar to those described here. The optimization of the transducer layer is different in this case. Here we are much more concerned with optimizing the optical properties of the transducers. The goal is to reduce the amount of blue light reaching the cell and either maximize the reflected or transmitted light, depending on the experiment requirements. We still have to ensure that the acoustic performance of the transducer is correct and that the acoustic bandwidth is sufficient to generate waves in the Brillouin frequency range of the sample.
Instrumentation advancements to enable imaging
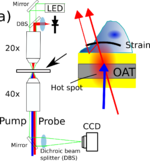
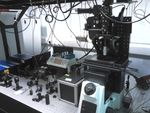
Measurements are made using a pump/probe picosecond laser ultrasound instrument utilizing ASOPS lasers. These laser control the delay between the pulse electronically removing the need to mechanically scan a delay line. this allows the very small signals present in these typos of experiments to be obtained quickly.
The pump beam is frequency doubled in a non linear crystal to have a wavelength of 390nm, the probe beam is at 790nm and both beams can be directed to the sample through and objective lens normal to the sample. optionally the pump beam can also be directed to the underside of the sample to generate the acoustic waves from below.
The instrument also has optical paths for wide field phase contrast imaging to allow the cells being studied to be visualized. This allows to assess the cells health and locate the scan region and register the acoustic image with the cell of interest.
The acoustic signals are captured by recording the probe beam power with a photo-diode, this signal is then filtered and amplified before being digitized in a digital oscilloscope. To build up an image the sample is raster scanned.
Ultrasonic imaging of cells
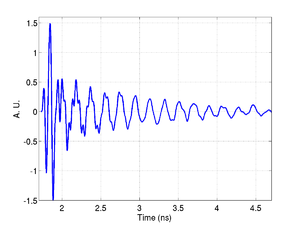
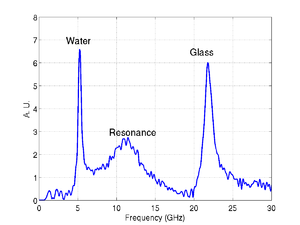
An example trace is shown below, there are three main components present in the signal. A signal from the transducer substrate, once from Brillouin oscialltions in the glass, and one from the cell or media. These signals are all clearly separated in the the frequency domain as shown by the FFT.
|
|
Fixed Cells
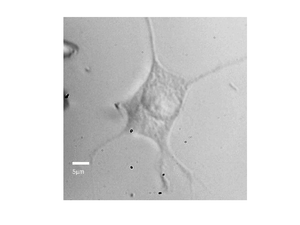
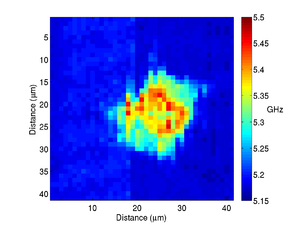
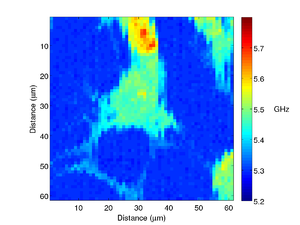
By recording the Brillouin frequency while scanning the sample images can be taken. The below shows a Brillouin frequency map of a fixed fibroblast cell, this image shows the location of the nucleus (the redder region).
|
|
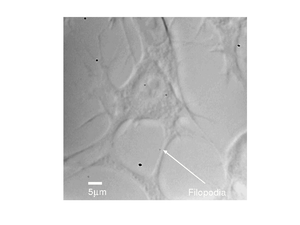
A different fibroblast cell is shown below, here we can see much more detail, with the filopodia clearly visible.
|
|
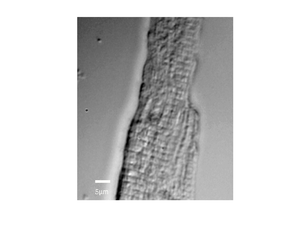
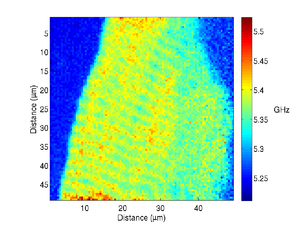
The image below shows a scan of a fixed cardiac cell, the striations of the cell are clearly visible, these repeating structures are how the cells contract, and have spacings on the order of a few microns.
|
|
Live Cells
3D imaging
It is possible to use signal processing techniques to extract more information from the data we obtain during the scans. By analyzing the frequency of the signal vs time we can extract changes in frequency with depth. This enables the mapping of internal structures in the cells, or should the acoustic ways leave the cell and enter the medium allows us to obtain a profile.
There are a number of different ways to do this, from relatively fast and simple methods (zero cross analysis) to more complex approach (wavelets).
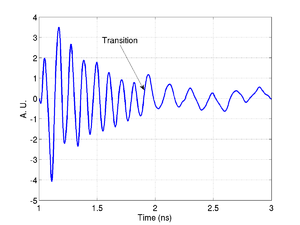
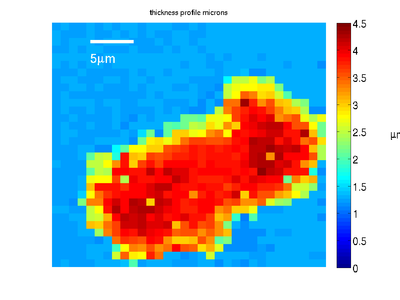
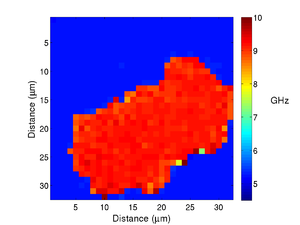
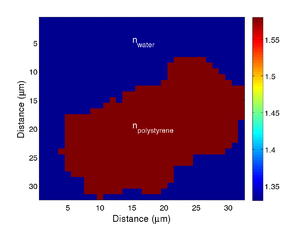
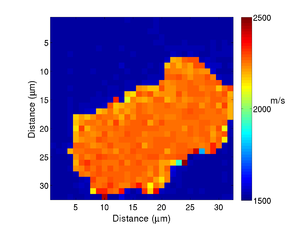
Below is an example of the process for a phantom cell made from polystyrene beads. In the time trace the transition from the phantom back to the media is clearly visible. By tracking this transition location in time and combining it with the Brillouin frequency and index maps, we can obtain a profile of the phantom cell.
|
|
|
Related Publications and Talks
Smith Richard J., Cota Fernando Perez, Marques Leonel, Chen Xuesheng, Arca Ahmet, Webb Kevin, Aylott Jonathon, Somekh Micheal G., Clark Matt - Optically excited nanoscale ultrasonic transducers
- The Journal of the Acoustical Society of America 137:219--227, jan 2015
- http://scitation.aip.org/content/asa/journal/jasa/137/1/10.1121/1.4904487
Bibtex<div>Author : Smith Richard J., Cota Fernando Perez, Marques Leonel, Chen Xuesheng, Arca Ahmet, Webb Kevin, Aylott Jonathon, Somekh Micheal G., Clark Matt
Title : Optically excited nanoscale ultrasonic transducers
In : The Journal of the Acoustical Society of America -
Address :
Date : jan 2015
</div>
Richard Smith, Fernando Perez, LeonelMarques, Matt Clark,Design and application of nano-scaled transducers,Institute of Physics Optics + Ultrasound One Day Meeting, May 2013, Nottingham, UK
Fernando Perez Cota, M. Clark, K. F. Webb, and R.J. Smith, Nanoscale transducers for picosecond laser ultrasonics in cells,3rd symposium of laser ultrasonics, June 2013, Yokohamma, Japan,
